
Table of Contents
- Becoming Familiar with the FX92 Test Set
- System Features & Settings Menu
- Test Application - DWDM C-band OCC
- File Manager - Results, Profiles & Screenshots
- NoApp® Contactless Results Transfer via NFC and QR
- Software Updates
1. Becoming Familiar with the FX92 Test Set
Optical Channel Checker (OCC), also known as Optical Channel Monitor (OCM) or Analyzer (OCA), is a more robust, practical and simplified version of Optical Spectrum Analyzer (OSA), for Dense Wavelength Division Multiplexing (DWDM) installation and maintenance application in the field. OCC monitors key performance indicators (KPI) in real time, including individual channels' center wavelengths, total optical channel power, and provides PASS/FAIL evaluations based on user selectable thresholds.
Applications vary widely depending on the type of network being tested. From validating individual dropped channels to monitoring multiple channels within a DWDM link and analyzing the level differences between two specific channels.
1.1 Key Platform Elements
The FX92 is part of VeEX's V90-series handheld product family (platform).

- Connector Panel - Test Port.
- LCD Screen with capacitive touchscreen.
- Power Button - Press to turn ON. Press and hold to turn OFF.
- USB Type-C Port - For DC charging and optional external dongles (e.g., memory stick, Ethernet adapter).
- Requires USB-C PD (Power Delivery) compatible charger and cable. Use the charger and cable supplied by VeEX! The smart USB-C PD charger must be capable of delivering 15 VDC and up to 3.0 Amps. Follow this link for more details about chargers.
- Smart NFC Tag – Bring a smartphone close to the Near Field Communication. transceiver to quicky transfer information from the test set to the web browser.
- System & Test Features Menu - Swipe down from the top of the screen to reveal system information, configuration and access the test set's main test features.
- Test Application Functions, Options & Settings – Swipe up from the bottom of the screen to reveal the active Test Application's functions and settings.
- Previous Page - Swipe right to go back to the previous page.
- Next Page - Swipe left to go to the next page available.
- Screen Capture - Swipe down, from the middle of the screen, using three fingers to capture a screenshot of the content currently being displayed. The image is saved in the File Manager with a generic timestamped (YYYYMMDD_hhmmss) name.
- Wi-Fi® & Bluetooth® - Optional built-in Wi-Fi and Bluetooth transceivers for management and remote access. Check datasheet for further details about versions and bands supported. (Factory-installed hardware option.)
1.2 FX92 Connector Pannel & Test Port

OCC - SC/APC Optical Channel Checker input port for C-band DWDM signals (included connector cover not shown on the picture). Refer to the product datasheet for detail specifications about wavelength ranges, levels, supported channel spacings and available options.
2. System Features & Settings Menu
Swipe down from the top to reveal the System, Settings & Tools menu. Swipe left or right to show more options and information. Swipe up from the bottom, or tap on the ![]() icon, to close.
icon, to close.


![]() Date & Time - Displays current date and time. Tap on this button to adjust the system's date, time, time format, time zone, etc.
Date & Time - Displays current date and time. Tap on this button to adjust the system's date, time, time format, time zone, etc.
![]() About - Provides test set's serial number, information, software version, licenses/options and system's internal storage details.
About - Provides test set's serial number, information, software version, licenses/options and system's internal storage details.
![]() Global Settings - General system configuration.
Global Settings - General system configuration.
![]() Owner Information - Create and access owners' profiles, with company and user contact information, to be added to test reports.
Owner Information - Create and access owners' profiles, with company and user contact information, to be added to test reports.
![]() Calculator - Simple calculator utility.
Calculator - Simple calculator utility.
![]() Screen Copy - The screenshot (screen capture) function saves the content of the screen (being displayed prior to opening the System Menu) into the File Manager, in PNG format, and organized under Screen file type. This is similar to using the three-finger swipe down. The image is saved in the File Manager with a YYYYMMDD_hhmmss name.
Screen Copy - The screenshot (screen capture) function saves the content of the screen (being displayed prior to opening the System Menu) into the File Manager, in PNG format, and organized under Screen file type. This is similar to using the three-finger swipe down. The image is saved in the File Manager with a YYYYMMDD_hhmmss name.
![]() Screen Lock - Touch this button to LOCK the touchscreen and prevent accidental operations. The screen content will be grayed out and the
Screen Lock - Touch this button to LOCK the touchscreen and prevent accidental operations. The screen content will be grayed out and the ![]() Unlock button will be displayed in different places of the screen. Touch and hold the
Unlock button will be displayed in different places of the screen. Touch and hold the ![]() button to UNLOCK the touchscreen.
button to UNLOCK the touchscreen.
![]() Cloud Services - Provides access to R-Server cloud services.
Cloud Services - Provides access to R-Server cloud services.
![]() File Manager - Access and manage test results, test profiles and screenshots. Files can be renamed, deleted, locked, shared, uploaded to R-Server or transferred to/from USB memory sticks.
File Manager - Access and manage test results, test profiles and screenshots. Files can be renamed, deleted, locked, shared, uploaded to R-Server or transferred to/from USB memory sticks.
![]() EZ Remote - Remote control cloud service (basic service provide free of charge). Enable/Disable remote access (Internet access required for the test set and the controlling PC, tablet or smartphone).
EZ Remote - Remote control cloud service (basic service provide free of charge). Enable/Disable remote access (Internet access required for the test set and the controlling PC, tablet or smartphone).
- Press the Connect button to register the test set on the EZ-Remote server (free cloud service) to make it available for others to use.
- Scan the QR code, with a smartphone of tablet, to send an Email of SMS/TXT notification to your peers. A direct link will be included in the messages, along with any comments and passwords edited into them, so remote users just have to click (or manually go to https://ezremote.veexinc.net and enter the test set's Serial Number and Password).
- For more information go to https://kb.veexinc.com/en/knowledge/remote-control-veex-test-sets.
![]() Wi-Fi - Turn the Wi-Fi radio OFF or ON and scan for local 802.11 b/g/n access points (AP) to stablish wireless Ethernet/IP connectivity. The test set's IP address will be displayed on the bottom-left corner of the screen.
Wi-Fi - Turn the Wi-Fi radio OFF or ON and scan for local 802.11 b/g/n access points (AP) to stablish wireless Ethernet/IP connectivity. The test set's IP address will be displayed on the bottom-left corner of the screen.
![]() Bluetooth - Bluetooth transceiver ON/OFF and pairing. A small Bluetooth indicator icon is also displayed on the top bar, when Bluetooth os ON and the test set is discoverable. Initiate the pairing process from the computing device (PC/tablet/phone) and use the last four digits of the S/N as PIN.
Bluetooth - Bluetooth transceiver ON/OFF and pairing. A small Bluetooth indicator icon is also displayed on the top bar, when Bluetooth os ON and the test set is discoverable. Initiate the pairing process from the computing device (PC/tablet/phone) and use the last four digits of the S/N as PIN.
![]() Battery Status - Displays current battery charge level, charging status, time to reach full charge or remaining operation time (under the current load conditions). A small power status icon is also displayed on the top bar.
Battery Status - Displays current battery charge level, charging status, time to reach full charge or remaining operation time (under the current load conditions). A small power status icon is also displayed on the top bar.
- A power LED above the screen indicates whether the test set is ON (green), OFF with charger plugged in (orange), or OFF without charger plugged (off).
- In Low Battery condition, the test set will start beeping to warn users that it needs to be recharged. If a charger is not plugged in on time, the test set will power itself OFF.
![]() Brightness Control - Touch the screen (LCD) backlight button and drag it UP and DOWN to increase and decrease the backlight intensity.
Brightness Control - Touch the screen (LCD) backlight button and drag it UP and DOWN to increase and decrease the backlight intensity.
![]() LAN - Configure the local (wired) Ethernet connection for the optional 1000BASE-T adapter (USB-C dongle).The test set's IP address will be displayed on the bottom-left corner of the screen.
LAN - Configure the local (wired) Ethernet connection for the optional 1000BASE-T adapter (USB-C dongle).The test set's IP address will be displayed on the bottom-left corner of the screen.
3. Test Application - DWDM C-band OCC
DWDM is a technology that transmits data over fiber optic cables by using multiple wavelengths of light (optical channels). This technology has been used in the core network and long-haul links for a long time. However, in recent years, it has become more common in Telecom, Mobile, Cable, and Data Center applications. With the increase in the need for bandwidth, communication service providers (CSP) are using DWDM to expand the capacity of their optical transport, front-haul and distribution networks.
OCC operation is less complicated and easier to use than an OSA to measuring Rx power on DWDM networks. Technicians are required to measure the power levels of individual DWDM channels to verify compliance with network specifications and detect imbalances. With its intuitive graphical user interface and simple to use operation, the FX92 OCC simplifies testing for DWDM technicians.
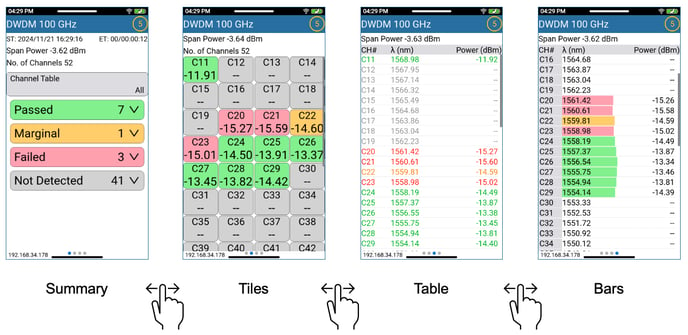
3.1 DWDM Optical Measurement Results - Four Simple View
The FX92 DWDM OCC provides multiple viewing modes to accommodate different testing and analysis needs. Each mode offers a unique way to visualize and interpret DWDM channel measurements, ensuring efficient troubleshooting and network optimization.
Users can switch between different modes based on their testing needs by swiping right or left:
-
Summary View – Provides a high-level overview of all detected channels in the test profile. This mode displays essential parameters such as the total number of detected channels and their status (pass, marginal, fail, or not detected) based on pre-set pass/fail thresholds. It is ideal for quickly assessing network health.

-
Tile View – Displays each channel in an individual, color-coded tile format, making it easy to distinguish between passing, failing, and marginal signals. Users can tap on any tile to view detailed power level readings for that specific channel, helping to pinpoint signal inconsistencies or imbalances.

-
Bar Graph View – Represents channel power levels visually using horizontal bars. This mode helps users quickly identify power imbalances, tilt across channels, and channels requiring attention. The color-coded bars (green for pass, yellow for marginal, red for fail) allow for at-a-glance analysis of signal strength and network performance.

-
Table View – Presents numerical data for each channel, including power levels, frequency, and wavelength. Users can sort the table based on different parameters, such as highest to lowest power or frequency order, making it a valuable tool for detailed documentation, compliance checks, and reporting.

To change display between frequency THz and wavelength nm, swipe up from the bottom to reveal the Function menu.
-
Toggle between
 Frequency or
  Wavelength to change the parameters displayed on screen.
 -
Select any parameter title to arrange the data in increasing/descending order, allowing for a clear comparison of values from highest-to-lowest and lowest-to-highest.

-
These viewing options ensure users can efficiently interpret measurement data, troubleshoot issues, and optimize network performance with ease.
3.2 Single Channel Optical Power Meter Mode
Designed for single-channel monitoring, this mode enables precise power measurement of an individual DWDM channel. It is useful for in-depth analysis of a specific signal, troubleshooting a particular wavelength, or verifying power levels before making adjustments to the network.
Select any individual channel from any of the viewing modes to access the Single Channel Optical Power Meter (OPM), allowing for a focused analysis of that specific signal.

When operating in the OPM mode, you see the channel number, the frequency/ wavelength of the channel and can monitor the average, minimum, and maximum power levels of that specific signal over a designated time period, providing valuable insights for analysis and troubleshooting.
3.3 Optical Channel Comparison
The AB Marker Optical Channel Comparison feature allows users to easily compare power levels between two selected channels to identify potential discrepancies.
-
This comparison helps detect power imbalances, signal drift, or inconsistencies that could impact network performance.
-
Power variations between channels may lead to crosstalk, reduced transmission efficiency, or the need for power adjustments to maintain signal integrity.
To use this feature, swipe up from the bottom to reveal the Function menu and tap on ![]() Markers.
Markers.
-
Follow the instructions on screen. Press OK to start feature. Look for the markers in the top right corner to indicate the feature has been toggled on.


-
By selecting two channels, the device automatically determines the gain or loss in power level, which reflects the difference in power between the two channels. Additionally, it calculates the span power, providing insights into the overall power variation between the selected channels.


This feature streamlines troubleshooting by providing technicians with immediate insights into channel performance, ensuring balanced signal levels across the DWDM spectrum.
3.4 Test Point Compensation (TPC) for Attenuation Adjustment
Using an attenuator with TPC helps protect the receiver from high input power while maintaining accurate power readings. Test Point Compensation (TPC) automatically adjusts for the attenuation by subtracting its impact from the measured power levels. This ensures that displayed measurements reflect the actual signal strength, even when attenuation is applied.
Enable TPC in the settings to ensure precise measurements when testing with an attenuator in the signal path. To use this function, swipe from the bottom to reveal the function menu.
-
Tap on
 Test Point Compensation icon and toggle on Enable.
-
Tap on
 to type and set the level of the attenuator you have in place.

-
Look for the indicator
 that is displayed on the main screen.
-
All values are now adjusting for the attenuation and subtracting the impact of it.
3.5 Power Measurement Verdict Filtering
The FX92 DWDM OCC allows users to filter power measurements into four status categories, to quickly assess channel performance:
-
Pass – Channels that meet performance standards.
-
Marginal – Channels near the threshold limit, requiring monitoring.
-
Fail – Channels with power levels below the acceptable threshold.
-
Not detected – Channels that your test profile indicates should existed but are not detected.
Swipe up from the bottom of the screen for the Function menu. Tap on ![]() Filter to toggle it on and bring up the Filter screen. Toggle Pass/Fail/Marginal/Undetected sliders to the left to turn certain channels off and hide from the screen.
Filter to toggle it on and bring up the Filter screen. Toggle Pass/Fail/Marginal/Undetected sliders to the left to turn certain channels off and hide from the screen.

Filtering by category helps users quickly identify problem areas, prioritize troubleshooting, and maintain optimal network performance.
3.6 Optical Measurement Maximum Hold
Within Bar Graph View, the Max Hold feature allows users to track the highest recorded power level for each channel over time. This helps in identifying signal fluctuations and monitoring long-term power stability.

To turn feature on, swipe up from the bottom to reveal the Function menu.
-
Tap on the
 Config button to open Configuration page
 -
Make sure Max Hold is toggled green as shown.

On the Bar Graph View, it is indicated by the grey bar that appears beneath the active signal bar. This grey bar represents the maximum power level detected for that channel during the measurement session. The active signal bar updates in real-time, allowing users to compare current power levels against historical peaks.

4. File Manager - Results, Profiles & Screenshots
 Swipe down from the top of the screen to reveal the System, Settings & Tools menu, then tap on the Files button to access and manage stored test results, test profiles (configurations) and screenshots (screen capture image files). A list of stored files is displayed.
Tap on the Results | Profiles | Screens, at the top of the page, to select the type of files to be displayed. The current type is highlighted in blue. Use the ![]() /
/![]() and
and ![]() /
/![]() to sort the files in descending or ascending order, based on file name or timestamp. The
to sort the files in descending or ascending order, based on file name or timestamp. The ![]() provides information about the amount of internal storage being used and the number of files currently stored.
provides information about the amount of internal storage being used and the number of files currently stored.
-
To manage individual files, select the desired file and swipe half-way to the left, to open the individual file Edit menu.
-
Touch and hold one of the files to access the multi-file functions and tap on
 when finished. (There must be at least one file stored in the test set for this to work.)


![]() Rename file.
Rename file.
![]() File Information - Shows basic test results details and Lock/Unlock function. Locked files can't be deleted.
File Information - Shows basic test results details and Lock/Unlock function. Locked files can't be deleted.
![]() Transfer File(s) - Share selected file(s) through
Transfer File(s) - Share selected file(s) through ![]() Bluetooth, export to attached
Bluetooth, export to attached ![]() USB memory stick (backup) or upload to
USB memory stick (backup) or upload to ![]() R-Server.
R-Server.
![]() Generate QR Code - Easily transfer test results to smartphones and tablets with NoApp cloud services. (The default setting for this function can be enabled or disabled in Settings, on the main menu.)
Generate QR Code - Easily transfer test results to smartphones and tablets with NoApp cloud services. (The default setting for this function can be enabled or disabled in Settings, on the main menu.)
![]() Delete individual file - Files can be
Delete individual file - Files can be ![]() locked to prevent accidental deletion.
locked to prevent accidental deletion.
![]() Delete all selected files.
Delete all selected files.
![]() From USB - Restores (loads) previously exported test results, profiles and screenshots from the attached USB memory stick.
From USB - Restores (loads) previously exported test results, profiles and screenshots from the attached USB memory stick.
5. NoApp® Contactless Results Transfer via NFC and QR
VeEX's NoApp® cloud service enables test sets to quickly and easily transfer test results' KPI to a phone or tablet, to instantly generate test reports, augment them with job-related information, notes/comments, geolocation, pictures, files, etc. It also allows the generation of PDF reports, sharing via email and SMS, or uploading to centralized R-Server cloud.
5.1 Using NFC Wireless Transfer
![]() The V90 series of test sets support Near Field Communications (NFC), which works in conjunction with VeEX's NoApp® cloud service to extract test results from the test set. To use it, just save the test results and bring the top of a modern smartphone close to the instrument's NFC logo. An NFC website notification should immediately appear. Tap on the pop-up message to access the test report. (Internet connection is required on the smartphone.). Click on the images for a quick demonstration video.
The V90 series of test sets support Near Field Communications (NFC), which works in conjunction with VeEX's NoApp® cloud service to extract test results from the test set. To use it, just save the test results and bring the top of a modern smartphone close to the instrument's NFC logo. An NFC website notification should immediately appear. Tap on the pop-up message to access the test report. (Internet connection is required on the smartphone.). Click on the images for a quick demonstration video.


With this innovative application of the solid NFC technology, the NoApp solution provides an always ready-to-use, up-to-date, contact-less, connectionless, secure, fast, simple and efficient test results data transfer, report generation and sharing platform. No preparation, settings or installation required!
The last test result saved may remain available on the NFC transceiver's memory, to be transferred at any time, even if the test set is OFF.
Since NFC is natively supported by modern smartphones, no recurrent IT approvals, no installations and no constant release updates are required for the everchanging iOS and Android ecosystems.
5.2 Using QR Code Transfer
When saving test results, users have the option to generate NoApp® QR codes (US Patent 12,190,199) to immediately transfer such results to a smartphone or tablet, using their native camera app or QR code reader functions. No application download, installation or settings are required. To enable it, just turn ON the Show NoApp QR Code on the Save Result file pop-up. The QR code gets generated as the test result file is saved. Scan the QR code below to try out the NoApp functionality. The default state for this slider button can be set to Enabled or Disabled by going to Settings, from the main menu.


6. Software Updates
Keeping the test set up to date, by upgrading its software to the latest available version, is very important. Download the installer package provided by VeEX and unzip (uncompress) the fx92-veex-arm.tar.gz installer package. The computer may identify it with a compressed folder icon, however there is no need to further uncompress it.
6.1 Using a Web Browser
- Verify that the test set's battery has >50% charge, it is connected to its charger and charging.
- Establish a LAN or WLAN (Wi-Fi) connection and note the test set's IP address.
- On a computer, connected to the same network, open a web browser and point it to the test set's IP address, to open its Web Remote Access page.

- Select Upgrade from the left menu.

- Click on Select File button and use the File Browser to select the uncompressed installer package, then click on Upload to transfer it to the test set.
- Once the file upload has finished and has been verified, click on the Upgrade button, then on OK to start the software update process in the test set.
- The test set may reboot multiple times during the process. DO NOT turn it OFF, until it has finished.
6.2 Using USB Memory Sticks
- Verify that the test set's battery has at least 50% charge, then turn the test set OFF.
- Create a folder on the USB memory stick named VeEX-V90-RELEASE and copy the file fx92-veex-arm.tar.gz into this folder.
- Insert the USB-C memory stick into the test set. (If using a USB-A memory stick, use the USB-A to USB-C adapter.)
- Turn the test set ON. It will boot up normally and, within 10-15 seconds, automatically detect the installer package file and initiate the software upgrade process. The test set may reboot multiple times during the process. DO NOT turn it OFF, until it has finished.