
If a bidirectional OTDR is not available, you can still use a standard OTDR, such as the FX150+, to acquire traces in both directions of the fiber under test. Then, load the two traces and arrange them in their correct orientation for simple visual (manual) events correlation and analysis. This method may be useful when specified by the work procedure (job) or when troubleshooting certain types of events, including gainers and ghost reflections, among others.
OTDRs, like the FX150+, allow you to overlay OTDR traces by taking two independent measurements from the opposite ends of a fiber span, adding descriptive names according to their directions, and loading them into the test set's Traces tab. This quick guide shows how to flip the B-to-A trace direction, select the A-to-B trace, and then use the Events tab to visualize the corresponding events aligned for loss calculation. The feature is limited to single trace, single wavelength, same pulse width tests, and does not include automatic bidirectional loss analysis or link mapping, which are available on the FX160 FiberBEAST™ bidirectional OLTS and OTDR for FTTx/PON and point-to-point applications.
You have to perform two OTDR measurements using the same settings:
-
First, measure from one end of the fiber span, let's call it site or side A, towards the other end, or side B. (You should replace A and B with the actual names of the sites, ports, cables and/or fiber strands.)

-
Then go to site B and make another OTDR measurement from B towards A, using the same settings (i.e., same launch fiber, wavelength, pulse width, span range, etc.).

-
If you need to test with multiple wavelengths, you can test them individually and save them separately. (You may include the wavelength in the name for quicker identification.)
-
If using launch fibers, make sure they are set correctly in the OTDR configuration, so they are deducted from the measurements. That is, both traces shall have the ports of the fiber under test as their 0 m (0 ft) mark, for the respective events to align properlyin both directions.
-
Make sure both traces get saved under the same \Job_ID \Cable_ID \Fiber_ID and labeled in a way that let you know in which direction the trace was taken. (These examples use the names a_b and b_a for simplicity.)
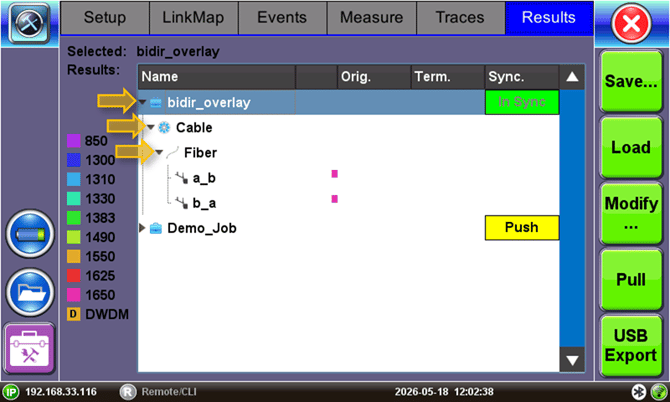
Once you have both sets of traces, go to the Results tab and tap on the triangular icons to expand the ![]() Job ID,
Job ID, ![]() Cable ID and
Cable ID and ![]() Fiber ID groups (tree) to show all the
Fiber ID groups (tree) to show all the ![]() Traces of interest.
Traces of interest.
-
Select the first trace containing the desired results for the A→B direction. It will be highlighted in blue. Press the
 Load button to add it to the displayed Traces tab.
 -
Select the second trace containing the desired results for the B→A direction and press the
Load button. -
Go to the Traces tab. The two selected traces are listed, and their graphs are being displayed on the Measure and Events tabs. (If there are other traces left from previous analyses, you can select them and tap on the Delete button, to remove them from this list.)
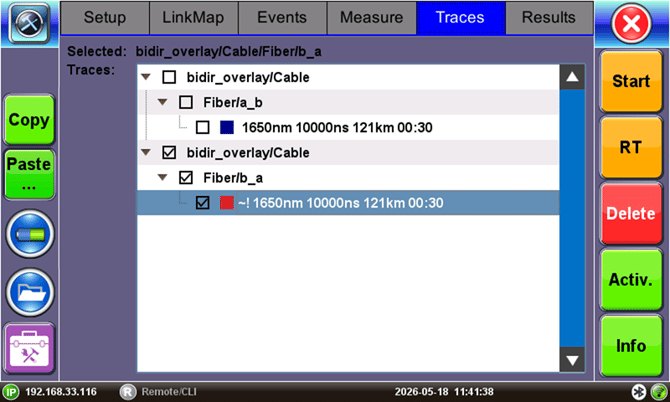
To assign the reverse B→A direction to the b_a example, select the B-to-A trace (it will be highlighted blue), press the ![]() Copy button, then
Copy button, then ![]() Paste, and select
Paste, and select ![]() B->A to assign the desired trace direction to it. A new reversed trace will be added under the B-to-A list.
B->A to assign the desired trace direction to it. A new reversed trace will be added under the B-to-A list.
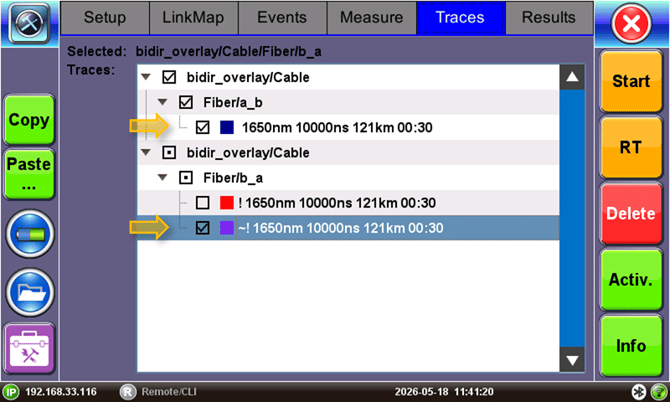
Now, select the original A-to-B and the newly reversed B-to-A traces, by checking the boxes next to them, and unchecking any other traces, so only these two traces of interest are displayed on the trace grid.
To view the bidirectional overlay of the selected traces, go to the Events or Measure tabs. The two traces will be displayed in a cross format (also known as "X-view"). In this format all the corresponding events should line up with each other. This is helpful to visualize, correlate, and calculate the actual loss at each event.
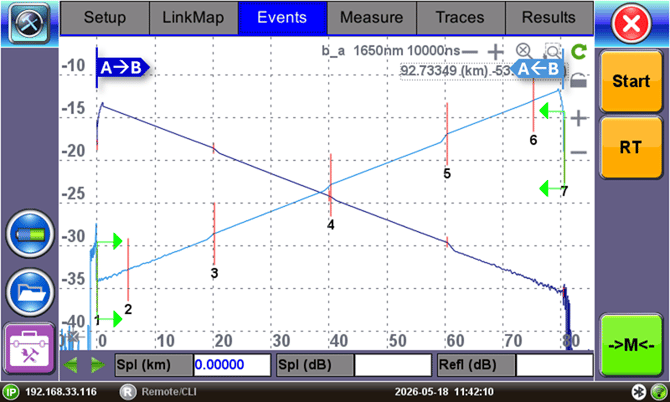
Now, you can visually correlate and analyze the events in both directions of the fiber under test and can manually calculate losses in either direction.
Note: This X-view display feature does not include a complete bidirectional analysis, so the actual bidirectional losses are not automatically calculated nor is a bidirectional link map created. However, these advanced analysis features can be found on the FX160 FiberBEAST™ Handheld Bidirectional OLTS and OTDR for FTTx/PON and Point-to-Point Applications, or performed with the Fiberizer® Cloud or the Fiberizer Desktop+ applications.