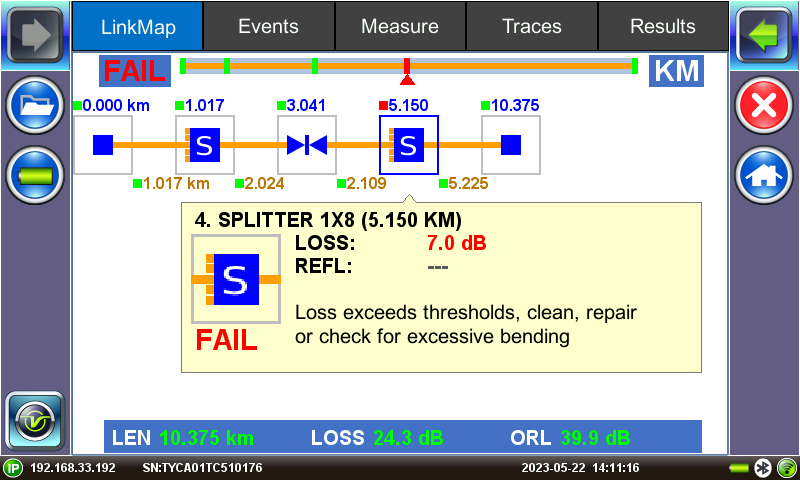
Why Two Events in the Link Map View, Displaying the Same Value, One Passes and the Other Fails?
The summary box in the Link Map screen rounds some of the values. In certain cases, a value below the threshold could be rounded up and another above the threshold could be rounded down. Refer to the Events Table for the actual values.

Such rare event could be caused by marginal values close to the events' PASS/FAIL threshold. The summary box in the fiber optics Link Map is a smart interpretation and visualization of OTDR traces, single or multiple wavelengths and/or multiple pulse widths (V-Scout). This block diagram representation function rounds up some of the values. Depending on how the thresholds are set for each event type, a reading just below the threshold could be rounded up (e.g., 6.955 dB → 7.0 dB) and one just above the threshold could be rounded down (e.g., 7.044 dB → 7.0 dB). If the threshold was set to 7.00 dB, the first would show a correct PASS and the second would FAIL. Even though both display 7.0 dB, their individual PASS/FAIL validations are done correctly.
We recommend looking at the actual readings from the Events Table, which display the full values used in the PASS/FAIL evaluation, with more significant digits.

Note: These screenshots are presented as GUI references only. They do not represent the specific case being discussed.
Related Topics
Related Test Solutions
- FX150+ - Mini OTDR (P2P or PON-optimized)
- FX160 FiberBEAST - Bidirectional OLTS and OTDR for PON and Point-to-Point
- MTTplus-410+ - OTDR test module
- RXT-4100+ - OTDR test module
- RXT-4113+ - xWDM OTDR test modules
- OPX-BOXe - Pocket-sized Mini OTDR
- FL150 - FaultScout (Fiber Optics Multimeter)
- RFTS-400 - Remote Fiber Test System (RFTS)
- RTU-4000 - Remote Fiber Test System (RFTS)
- Fiberizer - Cloud-based OTDR trace Analyzer and Repository
- VeEX Fiber Optics Test Solutions
