
The TX300s Test Platform is a family of factory-configurable telecommunication test and measurement equipment (different combinations of built-in test module hardware available). It comprises of a common Test Platform (host or chassis) and different interchangeable test modules (each geared toward specific applications and/or technologies).
When it comes to user interface (GUI), feature and functions, most VeEX products are very similar, with minor differences to accommodate for the test interfaces and specific hardware capabilities. This section is generic for all products listed, with the subtle differences considered intuitive enough.
1. Getting to Know the Test Set
As part of the basic package, users may receive one of the following test sets, test modules and accessories:
1.1 TX300s Test Platform

*External 1PPS & ToD RJ11 interface is not available in all hardware configurations. If available, this port can be used to discipline the built-in Atomic Clock option, with an external GNSS receiver.
1.2 Accessories & Hardware Options
- One AC/DC Adapter and Power Cord
- Optional carrying case (if ordered)
- Optional USB WiFi 802.11a/b/g/n/ac dual-band dongle (if ordered)
- Optional USB WiFi 802.11b/g/n + Bluetooth 4.0 dongle (if ordered)
- Optional USB Bluetooth dongle (if ordered)
- Optional Optical Transceivers (if ordered from VeEX)
- Optional GNSS or Multiband GNSS receiver (comes pre-installed)
- Optional GPS or Multiband GNSS portable antenna (if ordered)
- Optional Atomic Clock hardware option (built-in, not visible from the outside)
2. Basic Operation
2.1 Buttons

2.2 Turning the Test Set ON and OFF
- Trun ON: Press and hold the red Power button for two seconds, until a confirmation tone is heard and the power LED turns green (in noisy environments, refer to the power LED).
- Turn OFF: Press and hold the red Power button for about two seconds, until two confirmation tones are heard. Then the shutdown process will start.
- Forced Shut Down: In the rare case of a malfunction, our Customer Support team may instruct to press the Power button for about four seconds, until the screen turns off. Results, data or configurations are not saved.
Power Status LED
- OFF : Test set is OFF.
- ORANGE : Test Set is OFF and Battery is charging.
- GREEN : Test set is ON.
When the test set is ON and connected to the AC/DC charger, the battery icon on the top-right corner of the screen will show a changing state. Tapping on that button will provide more details.
Battery Status
- Low Battery status is indicated by a periodic beeping sound, every four seconds, and displaying a warning pop-up message on the screen.
When working on battery power, once the charge capacity reaches about 10%, the test set will start beeping to notify users to plug in the AC/DC adapter. A pop-up message may also be presented on the screen. When the charge level reaches 5%, the test set automatically initiates the shutdown process, to protect the battery.
Users can tap on the battery icon, displayed on the screen, to get information about the amount of battery charge and autonomy estimate (under current usage condition).
3. Get Ready to Test
3.1 Identifying Test Ports and Port Groups
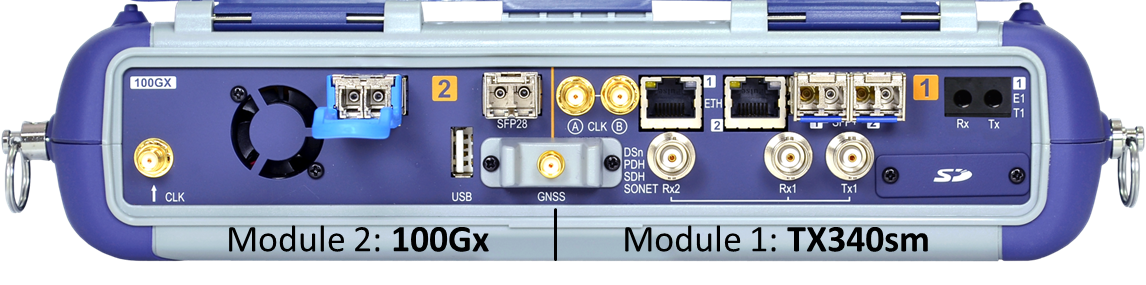
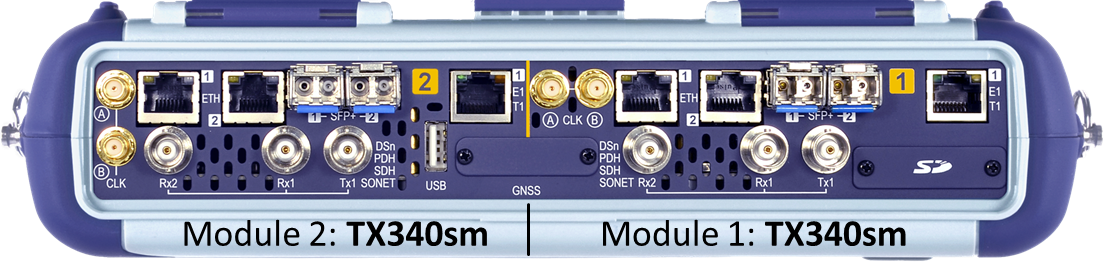
On the connector panel, test ports are identified by group numbers in white rounded squares. In multi-port test modules, each group can run one independent test. These groups are often referred as P1 and P2. In dual module units, the modules are identified by numbers in rounded orange squares, and they may also be referred as M1P1, M1P2, M2P1 and M2P2 (e.g., Module 1 Port 1).
Consider the test port groups as 'Test Resources' or 'Test heads'. Each one can run one test. The user interface will guide users through the available selections.
- TX300s with OTDR and TX320s Test Modules

- TX300s with 100G/Q and TX300s Test Modules

- TX300s with 100Gx Test Module

- TX300s with 100Gx and TX340s Test modules
- TX300s with Two TX340s Test Modules
3.2 Selecting the Test Port Group
- Identify the type of interface being used by the link or device to be tested
- On the test module, identify a test port group with an available port or transceiver type that matches the link or device under test. (Note: If you need to use a QSFP28 transceiver for 100GE, but Module 1 Port Group 1 is already running a 25GE test with SFP28, even if the P1 QSFP28 slot is available, it can't be used. Then you must select an available port from Port Group 2 or from Module 2. Each port group can only run one test.)
- From the GUI, select the test port group by tapping on the desired port group New button (one of the available Test Cards) according to the test interface required for the application. Depending on each individual test module and/or hardware configuration, the screen may display two, three or four test cards, with different test interface options.

- The test set will display the Test Mode Selection menu
3.3 Test Modes - Launching Test Applications
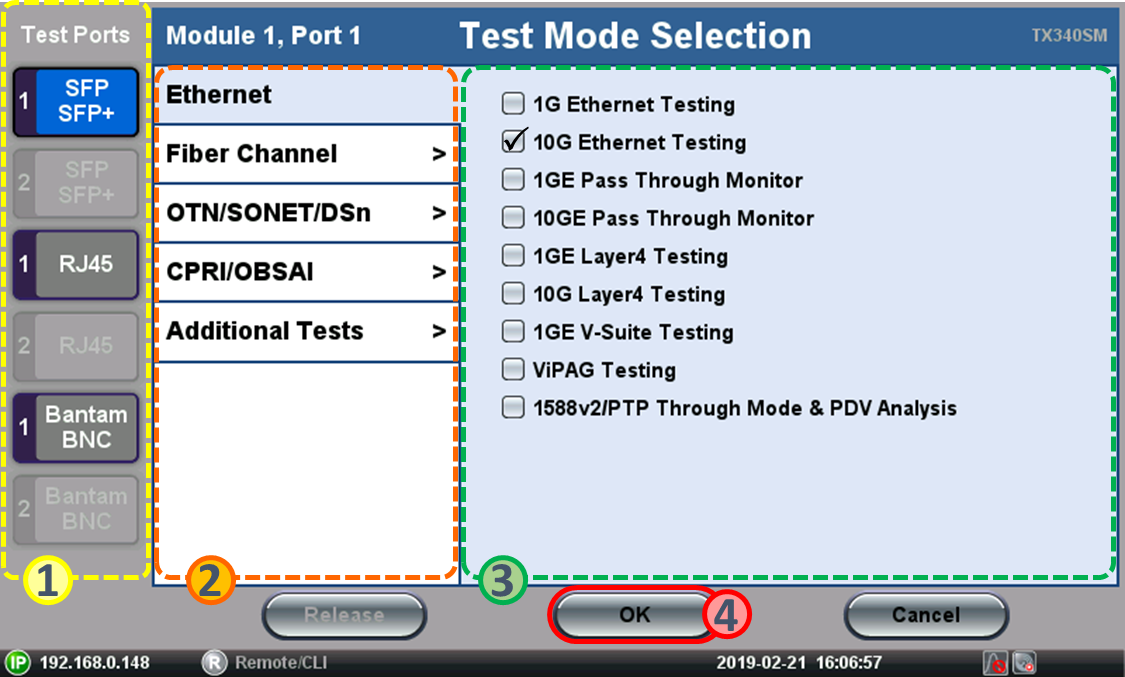
From the Test Mode Selection menu, users can select the desired:
- Test port, using the buttons on the left. (The available selection will change based on the capabilities of the selected port group.)
- Protocol (technology or link type), using the vertical tabs. (The available selection will depend on the capabilities of the selected port type.)
- Test Application, using the check boxes. (The available test functions will depend on the of the selected protocol and purchased licenses.)
- Press OK to launch the Test Application
The selected test application will start to launch (it may take several seconds).

Insert the required optical transceiver (if applicable) and connect the selected test port to the Fiber, Link, Line Card and/or Device Under Test (DUT), to set up the test scenario and start testing. Refer to the individual test module and test function manual for more details on the application.
Use the buttons on the left of the top bar to navigate between the different functions (System Tools/Utilities, Test Card Summary/Test Selector, Current Test/Change Test Mode)

System Tools & Utilities
 Tap here to access to the test platform (system) related settings, test results, utilities and certain tools (Fiber Scope, OTDR Viewer), including connectivity (LAN, WiFi, Bluetooth) and cloud-related applications like EZ-Remote, VeExpress, FTP, R-Server, etc.
Test Cards Summary / Application Switching
 Tap on this button to access the Test Cards Summary, in which users can have an overview of all active tests and test resource availability. Test applications can be terminated/released or new ones can be assigned.
Active Test Application
 This button indicates the current Port (1) and Module (2) being currently presented on the screen. Users can also tap on this button to change the Test Mode or Test Application for this port.
4. Information & Resources
For more information, refer to the TX300s Family Page: https://www.veexinc.com/products/tx300s