
Since all VeEX OTDRs have a similar user interface (GUI), the basic information provided in this article may also be relevant to other versions of OTDRs. However, there may be certain menu and feature variations depending on their specific applications, such as general-purpose point-to-point (P2P), passive optical networks (PON), or wavelength-division multiplexing (xWDM).
Refer to the OTDR Operation article for the latest, more generic, version of this quick guide.
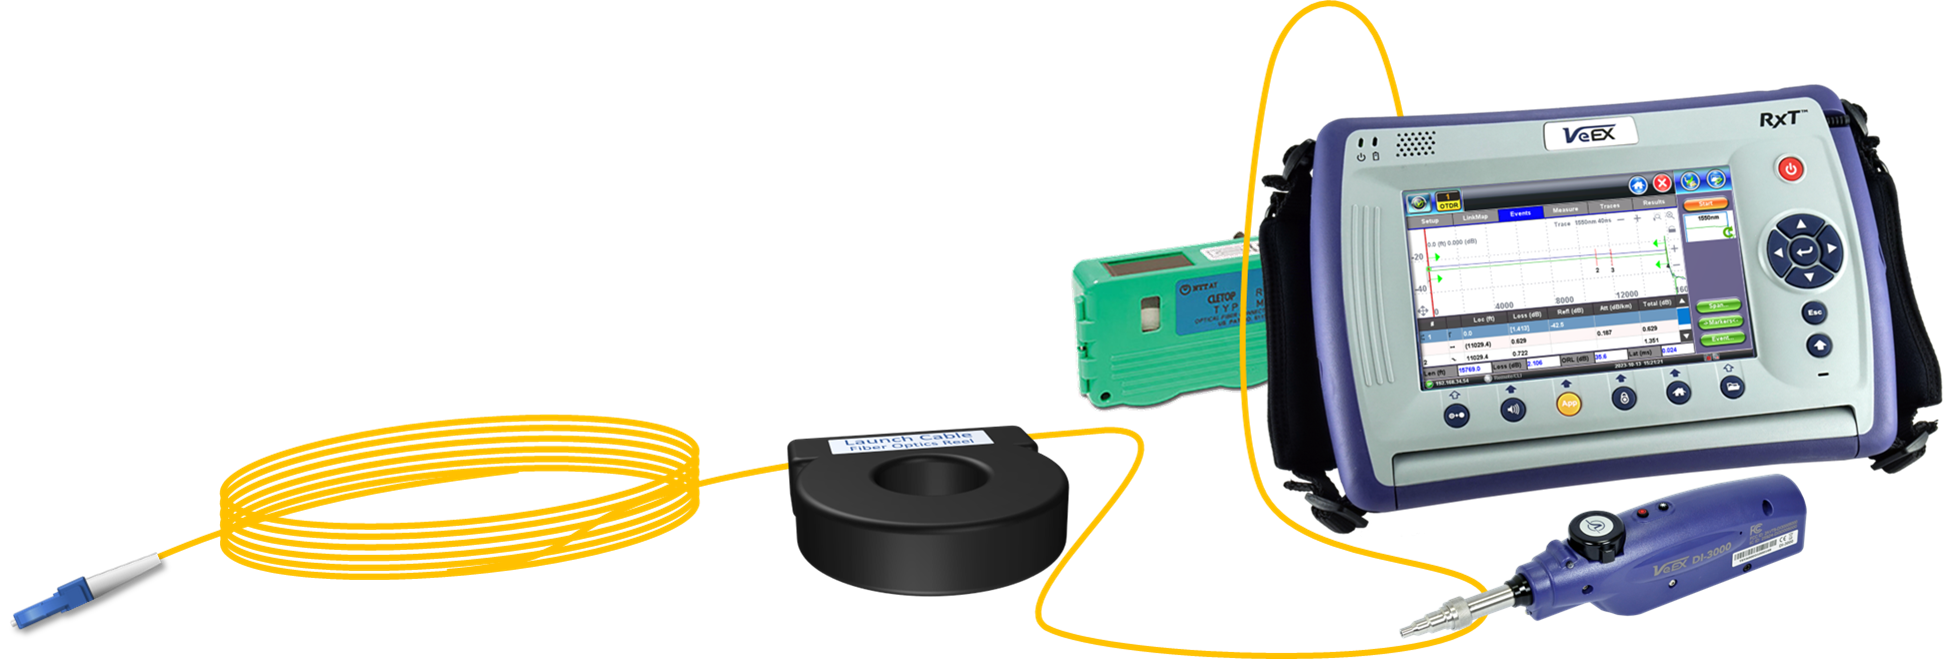
With the OTDR (Optical Time Domain Reflectometer) being the main test feature of the RXT-4100+ module, once the test set is turned ON, the user interface goes directly to the OTDR Setup tab and is ready to start testing fibers, using the default or previously used setting. Use the Display button to select the preferred units of measure (Distance Unit) and check that the rest of the setup (configuration) matches the link under test, before tapping on the Start button to begin a new test.
Make sure to always clean and inspect all the connectors before conducting any tests! This not only helps prevent inaccurate results caused by dirty or damaged connectors, but also safeguards your OTDR from potentially expensive repairs.
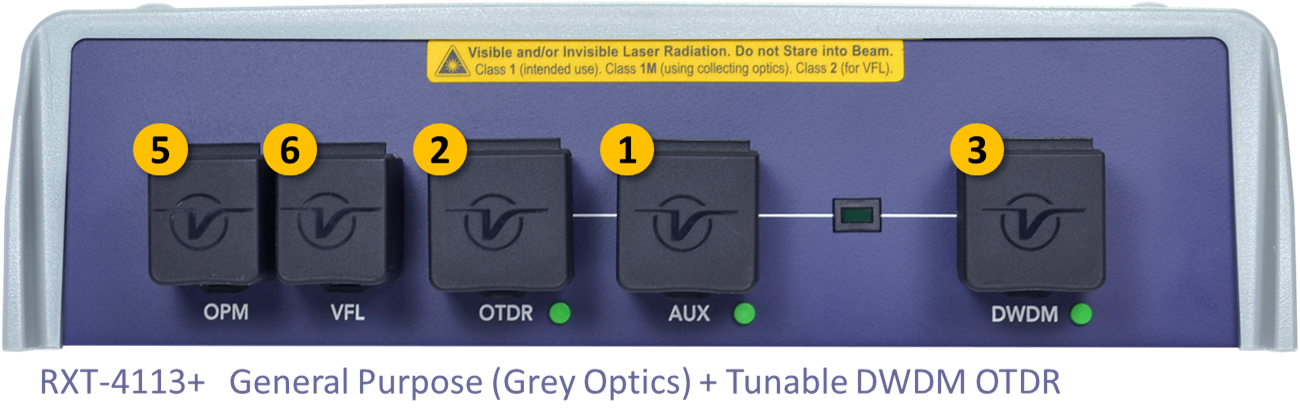
1. Connector Panels
The following examples show the full configuration for four of the OTDR versions available in the RXT family. Depending on the version and options selected, your OTDR may look different.
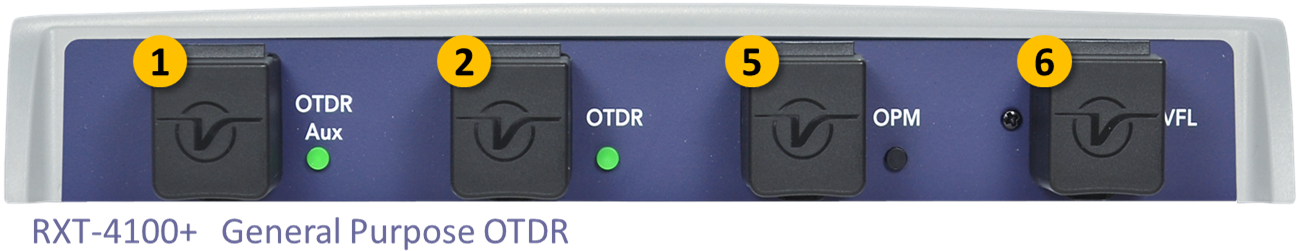


- Auxiliary OTDR Port - Its function depends on hardware configuration:
- Optional Live (Filtered) OTDR testing port with filtered 1625 or 1650 nm wavelengths.
- Optional multi-mode 850 and 1300 nm.
- Main OTDR Port - Traditional and PON-capable OTDR port, with selectable single-mode 1310, 1490, 1550 nm wavelengths. (High dynamic range versions support PON with up to two splitters with 1x32 splits total.)
- DWDM OTDR Port - Tunable to DWDM wavelengths per ITU-T G.694.1 (C-band, 1529.55 to 1563.86 nm, Channel numbers 17-60) in 50, 100 or 200 GHz steps. Extended channels 14-62 available as hardware option.
- CWDM OTDR Port - Tunable to CWDM wavelengths per ITU-T G.694.2 (8, 10, or 18 channels)
- OPM Port - Broadband Optical Power Meter
- VFL Port - Visual Fault Locator. Red (650 nm) light source.
Notes:
- The OTDR ports can also act as continuous or pulsed Optical Laser Source (OLS). OTDR and OLS functionalities are mutually exclusive modes of operation.
- RXT OTDR modules include an internal (built-in) 40m G.657A2 bend insensitive Launch Fiber as a standard feature, which is already compensated (calibrated out) at the factory, so no action required from the user.
- The RXT OTDR series is available in a wide variety of SMF or MMF wavelengths and dynamic range combinations. The list of supported wavelengths (WL) and their respective dynamic ranges (DR) are printed on the back label, along with any hardware options installed in the module.
Before Connecting: Know the difference between APC and UPC connectors. Angled Physical Contact (green body) connectors' end faces are polished at an 8º angle, while Ultra Physical Contact (blue body) connectors are polished flat. They are not compatible.
If the connector on the device, patch panel or fiber is green, has a green base, dot or marking next to it, it indicates it is an APC connector and requires the use of matching APC test cords. The use of APC connectors is common in modern OTDRs due to their lower optical return loss.


2. Main Menu
Use the ![]() Home or
Home or ![]() Fiber buttons to access the Main Menu, which lists all the major test features. (Since certain features and functions require specialized hardware versions, hardware options and/or software licenses, not all features described in this article may be available in your test set.)
Fiber buttons to access the Main Menu, which lists all the major test features. (Since certain features and functions require specialized hardware versions, hardware options and/or software licenses, not all features described in this article may be available in your test set.)
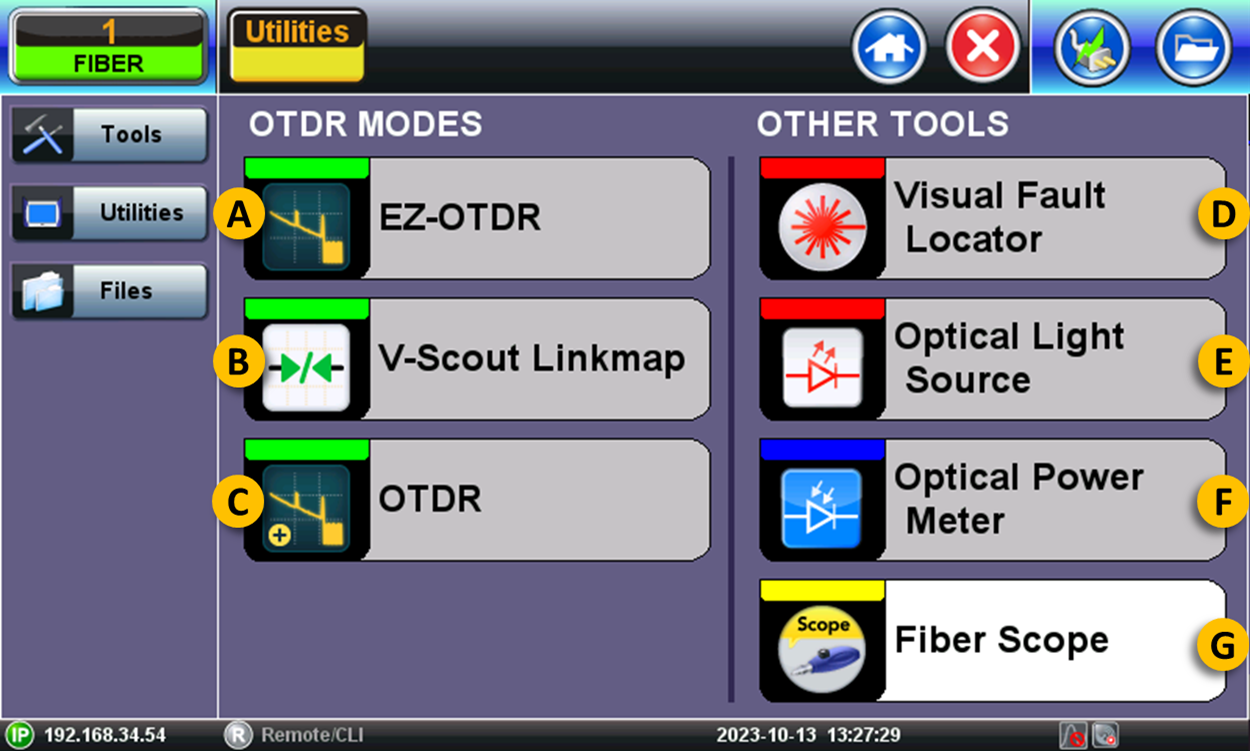
A. EZ-OTDR - This automatic (easy) mode is designed to assist new users in selecting the optimal single pulse test parameters for their specific link under test. It simplifies the analysis process and ensures accurate results.
B. V-Scout Link Map - OTDR measurement results can be represented in an automatic iconic Link Map interpretation of the events found. The link visibility can be significantly improved by using V-Scout's multiple pulse testing, providing better event details on links using automated pulses selection or custom V-Scout test profiles. For more details, refer to this Link Map & V-Scout article.
C. OTDR - Also known as "expert mode", it gives experienced users the ability to configure tests and fine-tune all parameters manually, based on the fiber link under test, for best test results.
D. Visual Fault Locator (VFL) - This tool generates a visible red light (at about 650 nm) to visually check for fiber continuity, macro bends, pinching, bad splices, cracks or breaks in the optical fiber.
C. Optical Light Source (OLS) - Uses the OTDR test port as a laser source, used to generate test signals of specific wavelengths to be tested for total fiber loss at the far end (with an OPM). Continuous wave (CW) sources may include the Wave ID (transmitter's wavelength encoded in the transmitted signal).
E. Optical Power Meter (OPM) - Uses a separate photo-detector port to measure the incoming power of an optical signal. Results can be presented as absolute power level (dBm) or relative link loss (dB). If the signal source (OLS) doesn't include the Wave ID, users can manually select the proper calibrated wavelength to match the incoming OLS signal.
Test sets with the capability of simultaneously performing OLS and OPM functionalities are referred as Optical Loss Test Sets (OLTS). In the case of VeEX OTDR, these are two independent tabs that allow them to be used simultaneously.
 F. Fiber Scope - Digital fiber inspection microscopes are optional external devices used to inspect the connectors' end face per IEC 61385-3 standard. The purpose of "scoping" is to ensure that all connectors are clean and undamaged, preventing additional losses, cross-contamination, scratches or causing damage to other connectors. Depending on the type of scope used, it can connect to the test set either via USB cable or Wi-Fi.
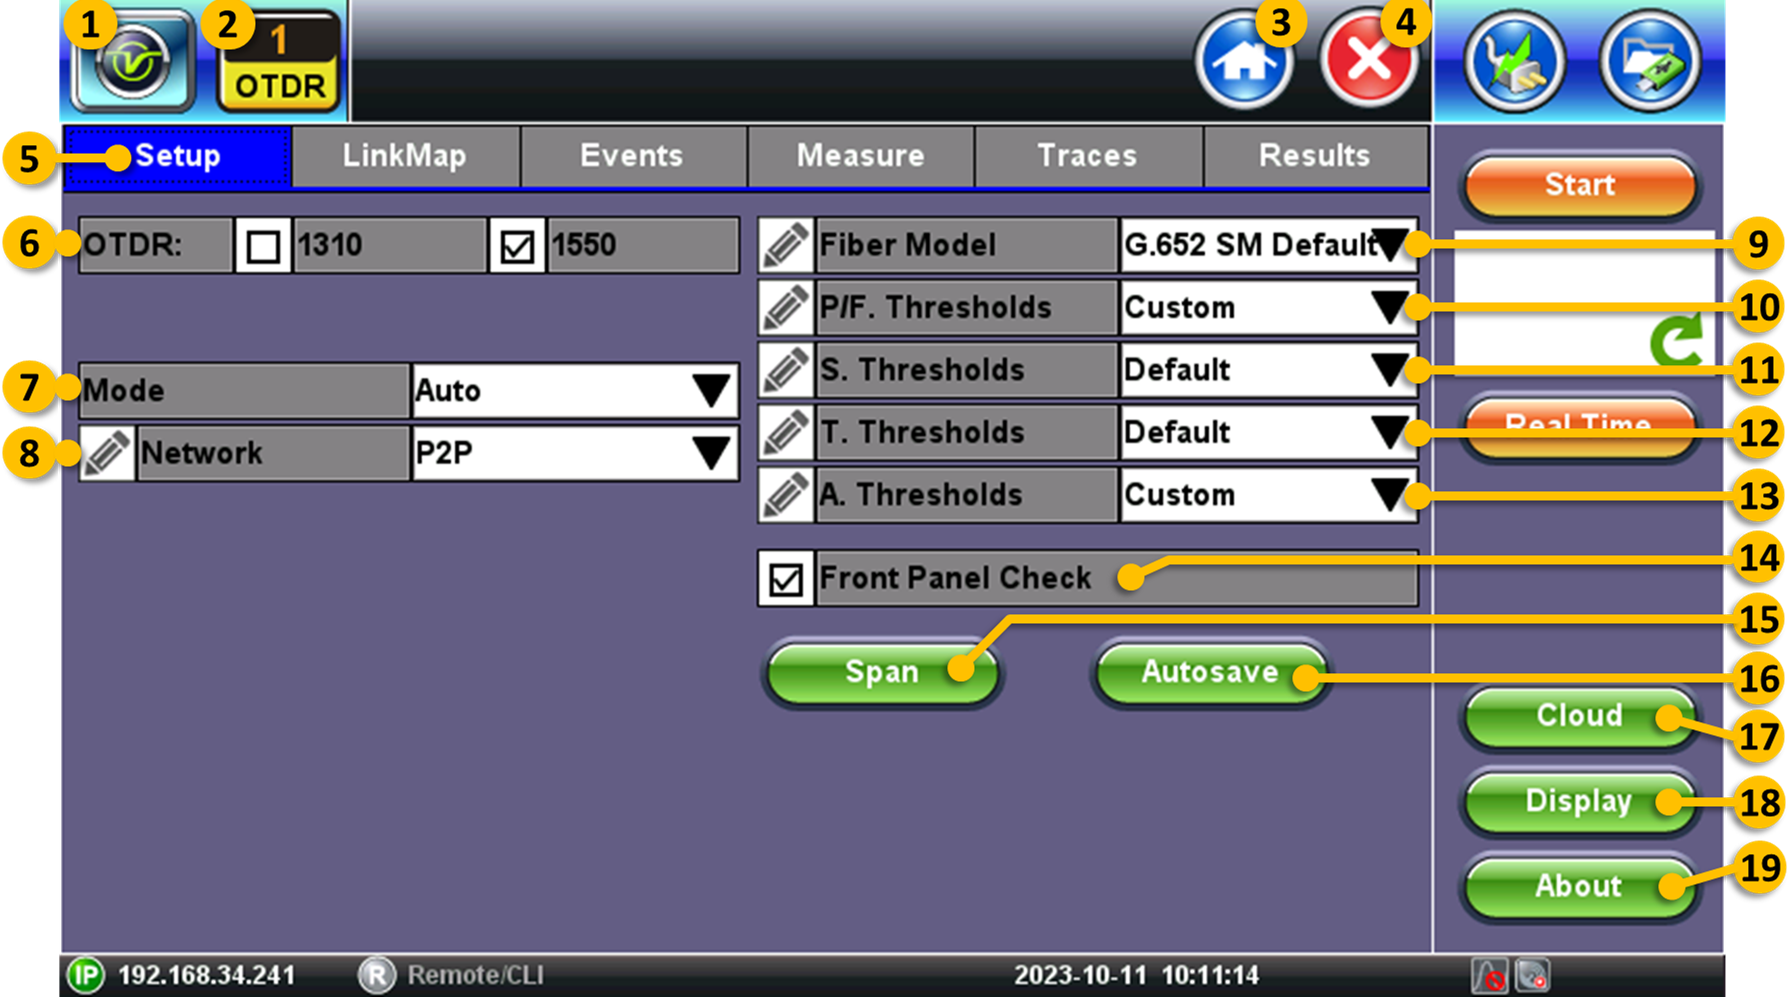
3. OTDR Setup
This tab contains minimum settings required before starting a fiber test.
 System Utilities - Tapping on this button brings users to the RXT-1200 Platform's system settings, utilities, tools and saved result files.
 OTDR - Active test application indicator. Other tools include VFL (Visual Fault Locator), OLS (Optical Light Source), OPM (Optical power meter), Fiber Scope. If the OTDR is fitted with an auxiliary OTDR port, an additional AUX field would list the wavelength(s) supported on that test port.
 Home - Tap on this button/icon to go directly to the main Fiber Menu. Use this button to switch between the different test modes and tools.
  Exit - Tap on this button/icon to go back to the previous menu level. It is not recommended to use this button to close a test application or tool.
- Setup - Select this tab to display the OTDR configuration.
- OTDR Wavelengths - Laser wavelengths to be used during the OTDR tests. If the OTDR is configured with the filtered Live test port or SM+MM option, the AUX field will be displayed below.
- Mode - Manual and Automatic modes.
- Auto - In this easy-to-use mode, the test set estimates the best test parameters (settings) applicable to the current link under test conditions. The software auto selects the test parameters using one pulse width per wavelength.
- Manual - In manual mode, experienced user is in control of the setting: Distance, Resolution, Pulse Width, Time, Optimization Method (Dynamic Range and/or Dead Zone).
- V-Scout - This optional feature is an innovative OTDR trace optimization feature that utilizes various pulse widths during testing to deliver highly accurate results and enhance event identification. This feature greatly simplifies fieldwork, particularly for novice technicians.
- Real Time (Auto or Manual) - Uses reduced averaging settings for quick troubleshooting and fiber check. Offers a faster trace refresh rate.
- Network - Select the type of network or link under test. Not all test modes are available in all OTDRS, since some of them require specialized hardware and licenses (e.g., traditional point-to-point OTDRs, PON-optimized OTDRs, xWDM OTDRs with tunable lasers, etc.).
- P2P - Test traditional Point-to-point fiber links, reels and cross-connect cables.
- PON (2 SPL) - Test passive optical networks with up to 2 splitters. Although the OTDR may not optimized for distributed PON networks, this mode can be used to check PON drop fibers and centralized PON networks with single splitter with 16 or 32 homes passed. Tap on the pencil icon to select between 1 or 2 splitters.
- WDM (Auto) - This advanced mode is available in high-end OTDRs with tunable CWDM and/or DWDM lasers. They let users select the channel spacing (grid) and the test channel. Tap on the
 Edit icon to manually set the number of multiplexers (MUX) in the link.
- Fiber Model - Select the type of fiber used in the link being tested, based on their index of refraction. Use the G.652 SM default for single mode fiber, unless you know exact glass type or want custom value. Use the pencil icon to enter custom values.
- P/F Thresholds - Defines the thresholds (minimum and maximum allowed limits or values) used to declare PASS or FAIL conditions for the different types of events.
- S. Thresholds - Defines the Pass/Fail thresholds for balanced Splitters.
- T. Thresholds - Defines the Pass/Fail thresholds for unbalanced splitters or Taps.
- A. Thresholds - Defines the overall Analysis Pass/Fail thresholds (e.g., splice loss, reflectance, macro bends, end of fiber).
- Front Panel Check - When enabled, it automatically checks the OTDR test port and cable connected to it. It will display a warning if the level is 1.5 dB below expected or if the initial reflectance is too high (default threshold is -45 dB). If the pre-check FAILS, clean and inspect the connectors and try again.
- Span - Enter or measure the calibration data for launch and receive (end) cables, if they are being used for the test. Lauch cables are used to remove the effects of the OTDR's dead zone, allowing the OTDR to measure the loss and reflection of the first connection in the link under test. It may also help protect the connector in the OTDR.
- Autosave - Enter information pertaining to the fiber cable under test, to allow for faster testing and auto indexing/documenting of the results.
- Cloud - Connection to VeEX's Fiberizer™ cloud storage, post analysis, management and reporting service (basic service is available free of charge).
- Display - Configures how the OTDR traces are physically displayed on the instrument's LCD screen, including the main units of measure (km, m, kft, ft, mi).
- About - Displays basic information about the instrument, including software version and supported wavelengths (lambdas).
Experienced users can tap on the ![]() Edit icon to customize the settings related to each particular field.
Edit icon to customize the settings related to each particular field.
Tap on the ![]() Start button to begin the OTDR test. The total test time will depend on the number of wavelengths selected, averaging and other parameters. The Start button will display the estimated time for each wavelength and the full trace window below will display the progress icon.
Start button to begin the OTDR test. The total test time will depend on the number of wavelengths selected, averaging and other parameters. The Start button will display the estimated time for each wavelength and the full trace window below will display the progress icon.
The Real Time button is used to start an OTDR test in continuous acquisition mode, so the trace on the screen refreshes constantly. Users must press the Stop button to manually terminate the test.
4. OTDR Results
4.1 Link Map View
It is a simplified iconic representation of the fiber link's test results, based on automated trace analysis, including all event types detected in the fiber under test.
The colored square (red or green) in front of each event distance (top) or segment lengths (bottom) indicate their specific Pass/Fail status, based on the different P/F Threshold settings.
For multi-wavelength tests, tap on the wavelength box ![]() , at the bottom, to view the test summary for each of the lambdas used during the test.
, at the bottom, to view the test summary for each of the lambdas used during the test.
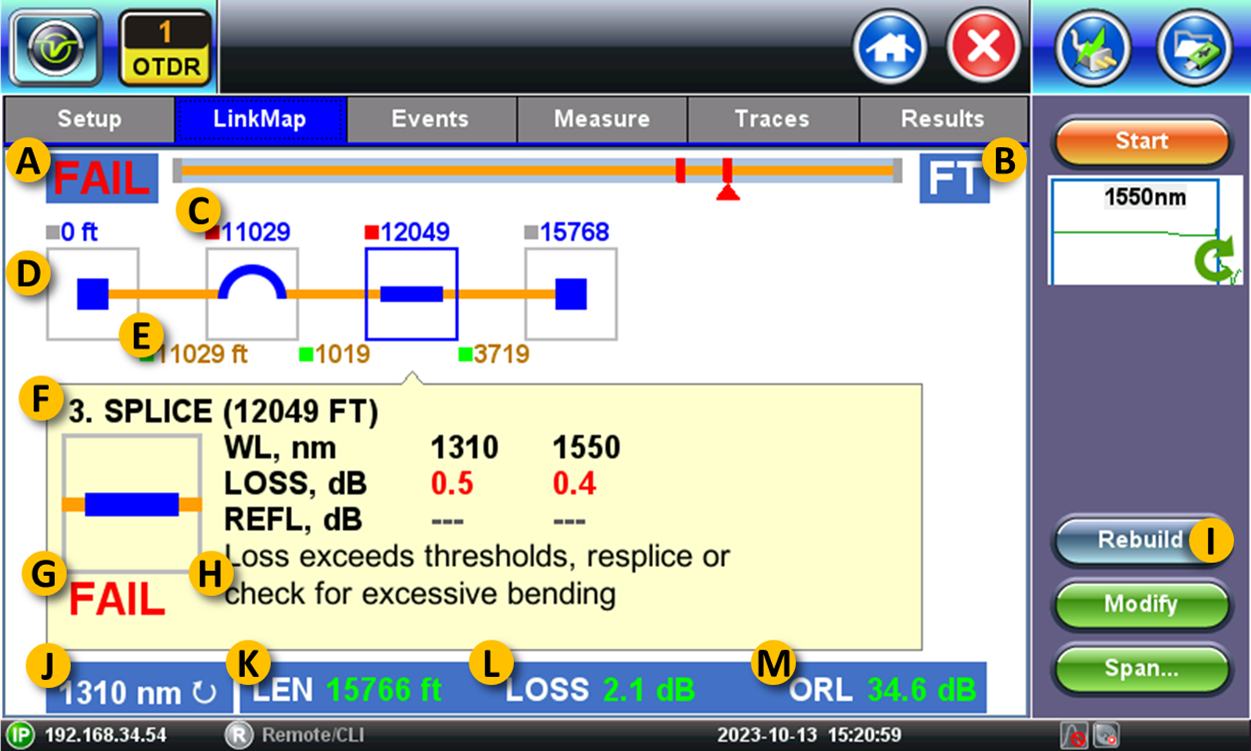
A. Overall PASS or FAIL indication for the link or fiber cable under test.
B. Units of measure (km, kft, ft). This can be modified using the Display button on the Setup tab.
C. Cumulative distance from the test point to the event.
D. The blue square highlights the selected events with detailed event-specific measurement data displayed in the yellow box.
E. Distance between consecutive events (segments).
F. Event number and type (based on automatic analysis). The event numbers correlate with the ones presented in the trace view and events table.
G. Event specific PASS (blank) or FAIL (red) indication, based on predefined limits (thresholds).
H. Suggested troubleshooting tips.
I. The Rebuild button forces the test set to reanalyze all visible traces, including any changes the user may have made to the thresholds or events.
J. Wavelength used for the analysis being presented. Tap on this box to display the results available for different wavelengths.
K. LEN – Total length of the fiber link or distance to the last event detected.
L. LOSS – Total link or cable attenuation.
M. ORL – Total optical return loss results.
Tapping on each of the event icons provide more particular details pertaining to that event, such as event description, associated measurement results and troubleshooting tips in case of failure.

Experienced users can tap on the Events tab to access the trace for more details and analysis.
Link Map benefits from the optional V-Scout feature, as it provides better event detection. For more details, refer to this Link Map & V-Scout article.
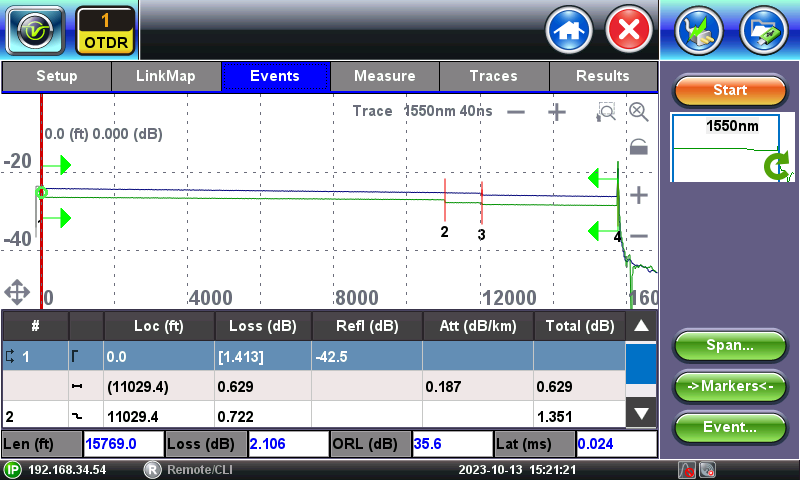
4.2 OTDR Trace
Horizontal ![]() /
/![]() - Zooms the horizontal scale IN and OUT, centering on the current cursor position.
- Zooms the horizontal scale IN and OUT, centering on the current cursor position.
Vertical ![]() /
/![]() - Zooms the vertical scale IN and OUT, centering on the current cursor position.
- Zooms the vertical scale IN and OUT, centering on the current cursor position.
![]() - Resets the zoom level to a full trace view.
- Resets the zoom level to a full trace view.
![]() /
/![]() - Locks and unlocks the horizontal and vertical zoom. When locked, the X and Y axis scale proportionally.
- Locks and unlocks the horizontal and vertical zoom. When locked, the X and Y axis scale proportionally.
![]() - Zoom Mode. Drag the stylus diagonally to establish a specific rectangular zoom area.
- Zoom Mode. Drag the stylus diagonally to establish a specific rectangular zoom area.
![]() - Scroll Mode. When enabled, it allows users to reposition the trace by dragging the stylus to the events' desired position on the screen. It automatically resets to zoom mode.
- Scroll Mode. When enabled, it allows users to reposition the trace by dragging the stylus to the events' desired position on the screen. It automatically resets to zoom mode.
![]() - Expands the trace to full screen view.
- Expands the trace to full screen view.
![]() - Restores the combined trace and events table view.
- Restores the combined trace and events table view.
![]() Span - Manually sets the current marker position as the beginning or end of the fiber. The green arrows indicate the Beginning and End of the fiber span.
Span - Manually sets the current marker position as the beginning or end of the fiber. The green arrows indicate the Beginning and End of the fiber span.
Markers - Brings the marker(s) to the center of the current (viewable) screen. This is a quick way to reposition the marker(s) to analyze an event.
Event - Manually edit the events table (edit, add or delete events). Advanced users can adjust the events found by the autodetection or create new ones that were missing.
 The small full trace window on the right, highlights the zoomed section of the trace (blue box) currently being displayed on the main trace screen. During acquisition (measuring) it also displays the progress for each wavelength being tested.
4.3 Trace Selection
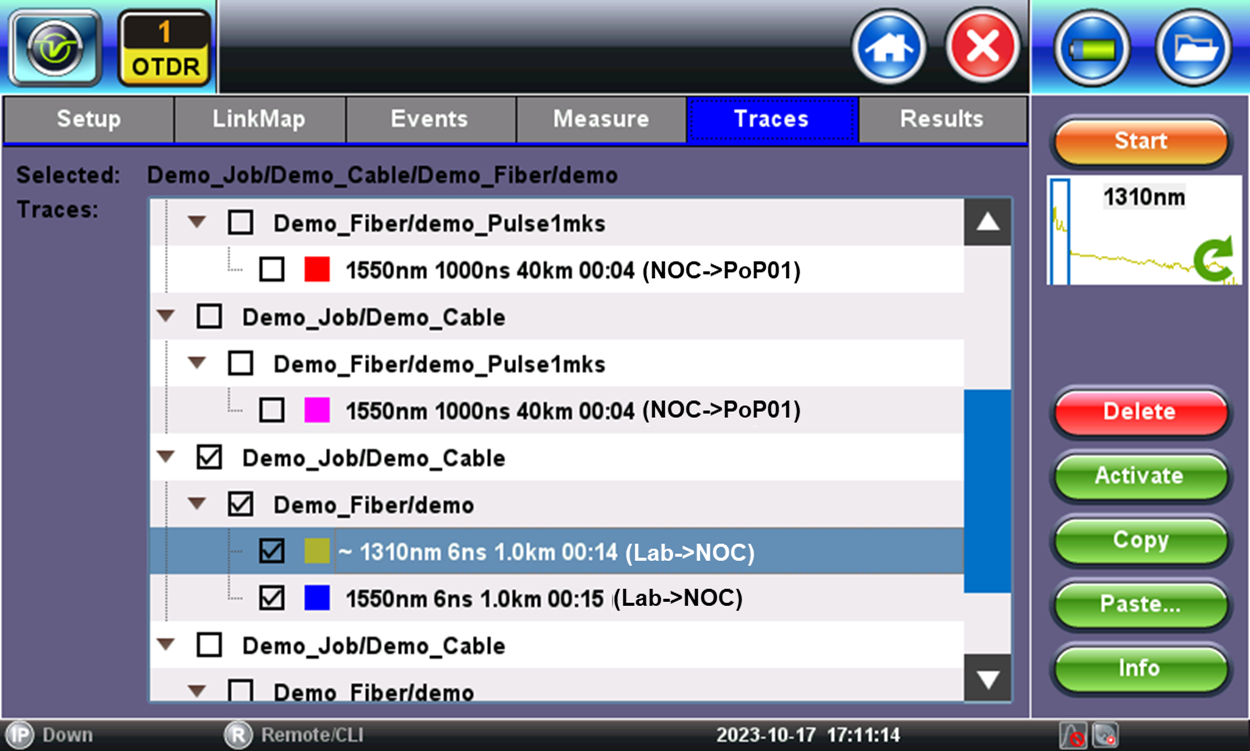
Use the check boxes in this hierarchical menu to select the different saved tests and traces to be displayed and analyzed. Users can also highlight a trace and tap on the Info button, to get details about the test.
4.4 Events Table
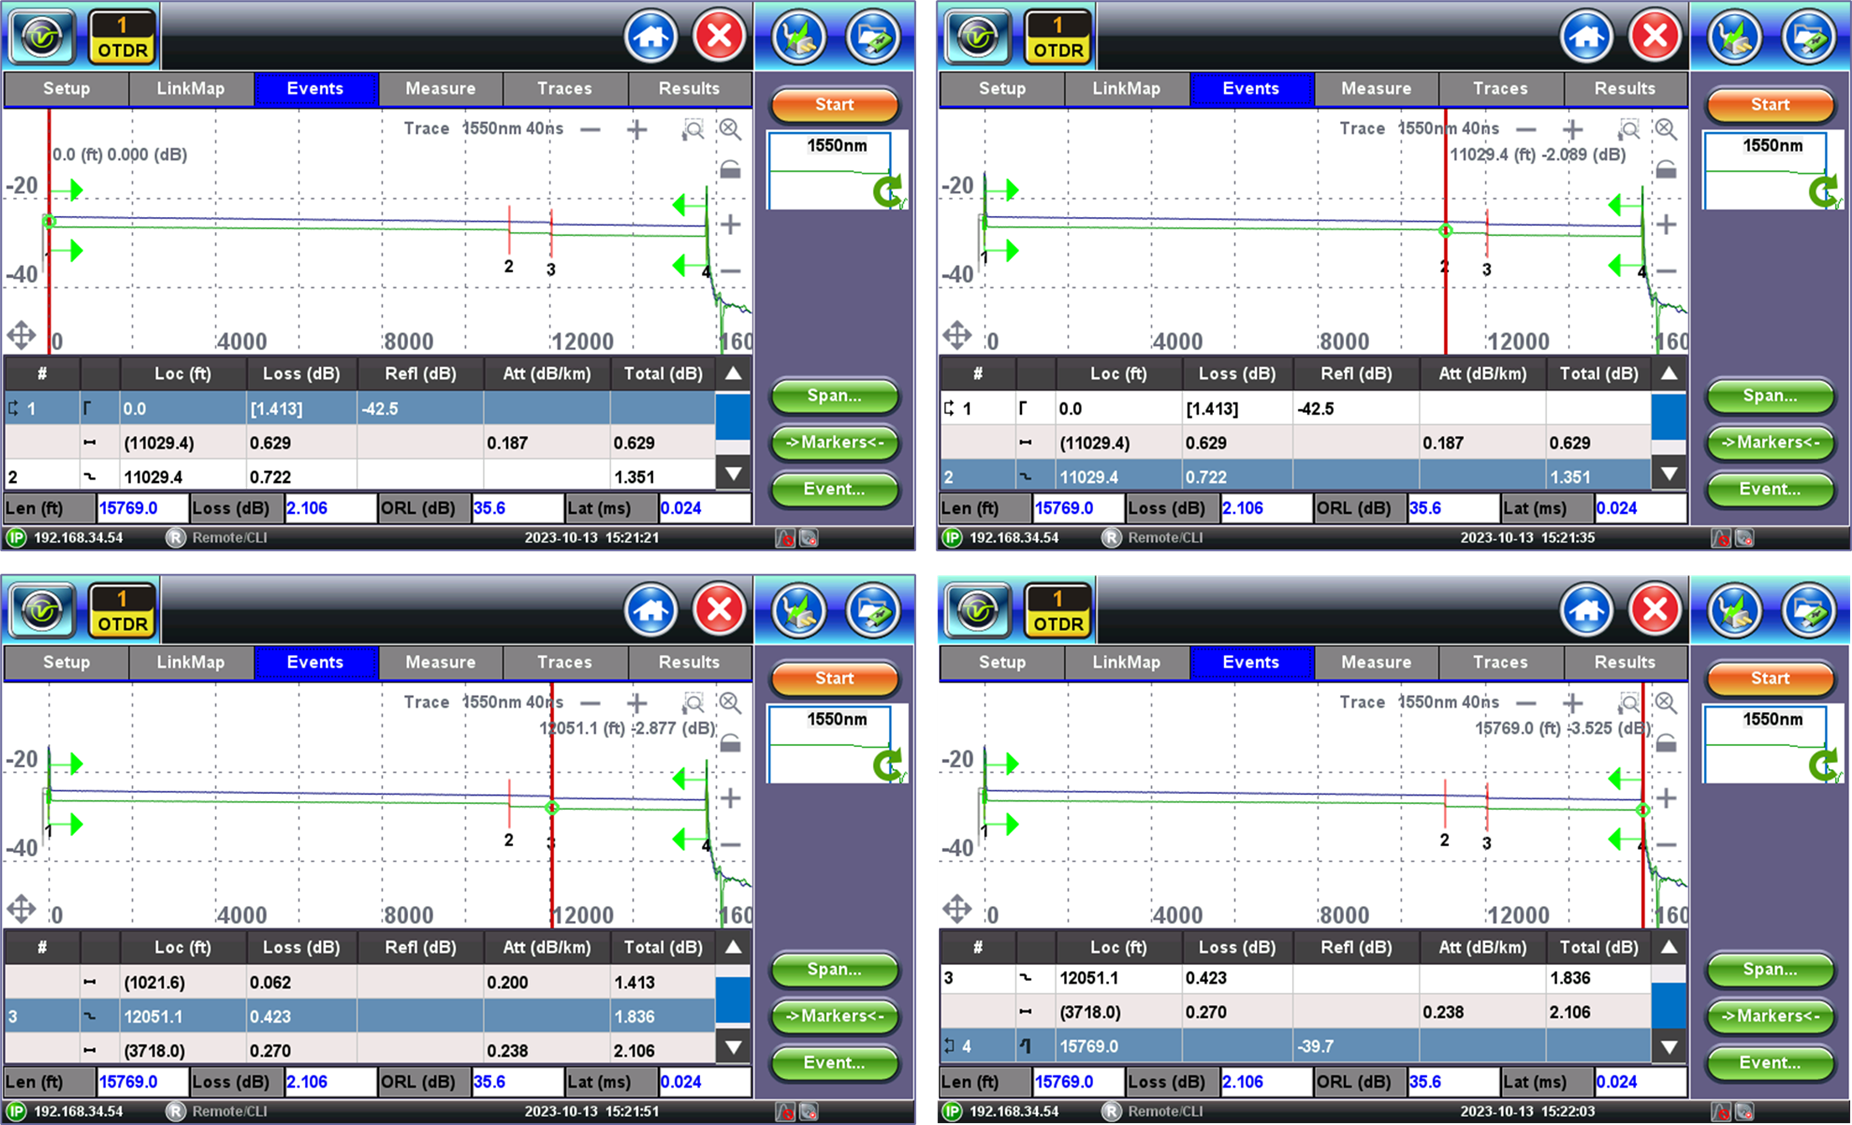
The table below the trace displays all the events and segments detected, with their measurement values, and correlates then to the trace (using the same event numbers as the Link Map and trace graphs). The red vertical cursor marks the position of the event selected on the table (the row highlighted in teal color).
4.5 Measurements
Experienced users can the Measure tap to perform specific event and loss measurements.
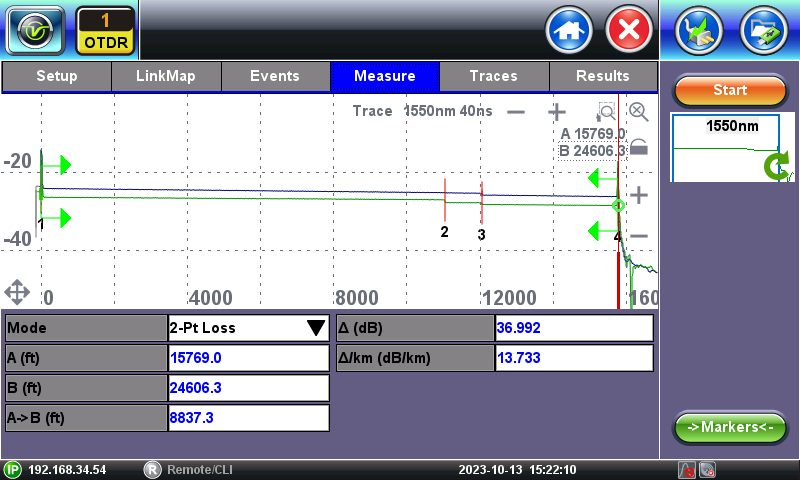
 2-point Loss Measurement - Measures the loss or attenuation (difference) between markers A and B. Select the desired event from the table, zoom in and use tap and drag the green circles in the marker-trace intersection to change the reposition of the A and B markers. Use the thicker handles at the bottom of the markers to reposition the segments.
 2-point (LSA) - The Least Square Approximation is a more accurate method to measure loss or attenuation. Zoom in and use tap and drag the green circles in the marker-trace intersection to change the reposition of the A and B markers. Use the thicker handles at the bottom of the markers to reposition the segments.
Reflectance - Reflectance measurements in dB, if the event is reflective.
Optical Return Loss - ORL measurements, in dB, is the total amount of light reflected back towards the OTDR test port.
 Splice Loss - Uses the four-marker method to accurately measure splice loss. Zoom in and drag the green circles in the marker-trace intersection to change the position of the individual markers. Use the thicker handles at the bottom of the markers to reposition all the segments at once.
4.6 Saved Results
OTDR files are saved in SOR file format. They can be augmented with extra information (job ID, comments, GPS coordinates, pictures, etc.) or saved as industry standard SOR (compatible with third-party OTDR viewer applications) format.
SOR: Defined by Belcore/Telcordia SR-4731, the Standard OTDR Record file format is used as an open industry-standard storage format for optical time-domain reflectometry (OTDR) test results (a.k.a. "traces"), which is commonly used by all vendors, for cross-platform compatibility*.
It contains fiber trace data, which includes distances, reflectance, loss, and fiber attenuation measurements, recorded by an OTDR instrument when testing a fiber optic cable.
*However, full compatibility among all vendors can't be guaranteed, if/when other vendors decide to customize their SOR files with proprietary data.
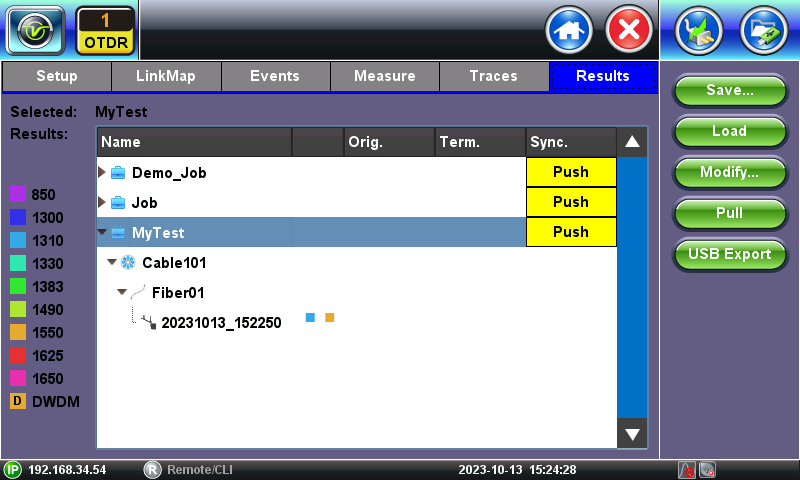
Save - Manually saves the current test results using manual or auto file name (when auto save is disabled),
Load - Load and display the selected trace files, for further analysis or reporting.
Modify - Rename or delete OTDR files.
Push - When connected to Internet, it uploads the selected test results to the user's, group or corporate active Fiberizer cloud account.
Pull - When connected to Internet, it is used to download test results from the user's, group or corporate active Fiberizer cloud account into the test set.
USB Export - Exports the selected test results files to a USB memory stick, in either flat structure (individual SOR files) or using an organized tree directory format. An \OTDR Exports folder is created in the memory stick.
5. Other Tools
For information about VFL (Visual Fault Locator), OLS (Optical Light Source), OPM (Optical power meter) and Fiber Scope operation, please refer to the User's Manual.
Related Reading Material
- RXT-1200 Modular Test Platform - Quick Start Guide
- Understanding Optical Time Domain Reflectometry (OTDR)
- Measuring OTDR Reflectance and Optical Return Loss (ORL)
- OTDR User's Manual
- V-Scout and Link Map
Related Test Solutions
- RXT-4100+ - OTDR test module
- RXT-4113+ - xWDM OTDR test modules
- RXT-1200 - Modular Test Platform
- MTTplus-410+ - OTDR test module
- FX150+ - Mini OTDR
- OPX-BOXe - Pocket-sized Mini OTDR
- FL150 - FaultScout (Fiber Optic Multimeter)
- RTU-4000 - Remote Fiber Test System (RFTS)
- Fiberizer - Cloud-based OTDR trace Analyzer and Repository
- VeEX Fiber Optics Test Solutions
A. Glossary, Acronyms & Abbreviations
Δ - Delta (difference)
Att - Attenuation (dB)
BC - (Rayleigh) Backscatter Coefficient (dB)
CEx - Coexistence (multiple optical signals/services sharing the same fiber or optical network)
CoEx - Coexistence (multiple optical signals/services sharing the same fiber or optical network)
Conn. - Connector
CW - Continuous Wave (laser source always on)
CWDM - Coarse Wavelength Division Multiplexing
dL - Resolution (length)
DR - Dynamic Range
DZ - Dead Zone
DWDM - Dense Wavelength Division Multiplexing
EZ - Easy (auto)
F - Filtered (Test ports that only work with specific wavelengths, e.g., 1650nm(F))
Fib. - Fiber
FT - Feet (ft)
Grey Optics - Term that refers to traditional laser wavelengths normally used for P2P transmission of single signals over dedicated fibers (e.g., 1300, 1310, 1550 nm). Opposite to the "Colored" optics (wavelengths) used in WDM and coexistent applications.
GUI - Graphical User Interface
ID - Identification (e.g., Technician ID, Node ID, OTDR type ID, Wave ID, etc.)
KFT - Kilofeet (kft)
KM - Kilometers (km)
Lat - Latency (one-way time of flight, in ms)
Len - Length (m, km, ft, kf, mi)
Loc - Location, distance to the event (m, km, ft, kf, mi)
LSA - Least Square Approximation
M - Meters (m)
MI - Miles (mi)
MM - Multi Mode (laser, signal)
MMF - Multi Mode Fiber
MUX - Multiplexer (e.g., CWDM, DWDM)
nm - Nanometer (wavelength)
OCWR - Optical Continuous Wave Reflectometry
OLS - Optical Light/Laser Source
OLTS - Optical Loss Test Set
OPM - Optical Power Meter
Orig. - Originating Location (where the fiber is being tested from)
P/F - Pass/Fail evaluation
P2P - Point to Point
PON - Passive Optical Network
Pt - Point
Refl - Reflectance (dB)
RI - Refractive Index
RL - Return Loss
S/N - Serial Number
SM - Single Mode (laser, signal)
SMF - Single Mode Fiber
SOR - Standard OTDR Record
SPL - Splitter
Sync. - Synchronize (with Fiberizer cloud)
Tech - Technician or person performing the test
Term. - Terminating Location (where the end of the fiber is)
Thru - Through (pass-through)
THz - Terahertz (Lightwave frequency)
TLS - Tunable Laser/Light Source
Tot. - Total
Tp - Test Pulse width (ns)
UI - User Interface
VFL - Visual Fault Locator
Wave ID - An OLS may be capable of encoding the signal's wavelength information into the CW source it generates, so the OPM at the far end can automatically select the correct calibration table for said wavelength. It helps prevent human error when testing attenuation or loss.
WDM - Wavelength Division Multiplexing
WL - Wavelength (also known as Lambda or λ)