

1. Introduction to C37.94
The IEEE C37.94™-2002 (latest revision in 2017) and IEC 62843:2013 standards define a multi-vendor optical transmission interface to be used by power utility companies to replace existing electrical supervisory control and data acquisition links with fiber optics. Low level electrical links were considered unreliable for use in the power industry as they are prone to interference and damages due to intra-substation electromagnetic interference (EMI), electric shock, signal ground loops, ground potential rise and safety, among other electrical issues. Optical links and fiber optics don’t have such problems.
C37.94 was originally specified as an 850 nm multimode fiber (MMF) interface using legacy ST (BFOC/2.5) optical connectors. However, modern implementations also use 1310 nm MMF and single-mode fiber (SMF) variants with other connector types, such as the duplex LC-PC connectors commonly used in SFP transceivers.
It is capable of transmitting a single data stream at Nx64 kbit/s, with N being anywhere between 1 to 12 (64 to 768 kbit/s). It uses a simple faming structure and an optical line rate of 2,048 kbit/s. Every logical bit in the data channel (layer) is encoded as a two-bit physical layer symbol consisting of the original data bit and its complement (01 or 10) assuring enough transitions to help with clock recovery.
The C37.94 test feature requires special SFP transceivers. Do not use regular SDH/SONET or Ethernet transceivers, because they don't support the low 2.048 kbit/s line rate required. Contact us if you don't have the right transceivers (VeEX P/N: 301-01-018G for 850 nm MMF or 301-0120G for 1310 nm SMF).
The frame alignment signal is carried in the header, as a 16-bit pattern that alternates every frame:
- Framing pattern 1: 1001 1011 0000 1111
- Framing pattern 2: 11Y1 1111 0000 1111
Y = Yellow alarm or Remote Defect Indication (RDI) bit. A 1 indicates an alarmed condition.
These frame alignment patterns are immediately followed by a 48-bit overhead sequence:
-
p -p q -q r -r s -s 1 0 1 0 1 0 … 1 0 1 0
The pqrs bits (and their complements) encode the N value, or data rate multiplier (N × 64 kbit/s).
The subsequent five time slots carry an alternating 10101010... pattern, used to seed the clock recovery circuitry and act as a preamble for the client data.
1.1 Loss of Signal (LOS) and Loss of Frame Alignment (LOF)
Although the standard recognizes the ITU-T G.706 LOF definition as the event that starts after the detection of three consecutive incorrect frame alignment signals, IEEE considers the loss of framing a link Loss of Signal (LOS) condition. In C37.94, LOS is declared when the optical signal is too low or the frame alignment is lost.
Per IEEE, the LOS condition is declared upon receiving two or more errors in eight consecutive framing patterns and cleared upon receiving eight consecutive correct framing patterns.
VeEX test sets repot Frame (induced) LOS and Optical Signal (induced) LOS separately, to provide extra information to users for better problem isolation and troubleshooting purposes.
1.2 Remote Defect Indication (RDI) and Yellow Alarm
Although the IEEE C37.94 refers to RDI path defects (as defined by ITU-T G.775), their official name for this far-end alarm status is Yellow alarm. RDI has become a more common term, but some users may use RDI and others Yellow, to refer to the alarm sent by the far end to indicate that there is a problem with the received signal. The yellow alarm indicator is carried on the third bit (Y) of the second fame alignment signal.
1.3 Alarm Indication Signal (AIS)
When a network element declares loss of signal at its receiver, it sends a Yellow (RDI) alarm back to the originating equipment to notify the problem and an AIS alarm to all other equipment located upstream (in the direction of the original transmission). The AIS consist in replacing data channels’ line bits (time slots 8 to 31) with an All 1s pattern.
2. Getting Started
2.1 Starting the C37.94 Test Application
Turn the test set ON. (The user interface may look slightly different depending on the test set being used, however the flow and settings are very similar.)

- From the welcome screen, select the Test Port Group 1 or 2 (if applicable) or select the
 Test Card View button and then select the desired Test Port.
 - On the Test Mode Selection menu, tap on the SFP/SFP+ test port button. Make sure that a C37.94 compatible SFP is used for this application.
- Select Additional Tests from the technologies section.
- Select the C37.94 Testing (Single Port) or C37.94 Pass-Through & Monitor (Dual Port) test application mode.
- The C37.94 in-line monitor test mode, available in the TX340s, is used for in-line bidirectional monitoring in pass-through* mode. In this mode, the test set acts as a repeater.
- Pass-Through used both SFP ports (P1+P2) and requires two SFP transceivers.
- Press OK to start the selected C37.94 test application.
After a few seconds the C37.94 Menu is displayed and the application button turns yellow or purple (active), displaying C37.94 as the application running.
* In-line pass-through, also known as “transparent” mode, is an intrusive test that may not be recommended in certain cases for the following reasons:
(a) It changes the condition of the link under tests. The signal is regenerated with clean shape and full power, removing the effects from long fiber links, which are common causes of problems in point-to-point optical links.
(b) Changing the settings or losing power will make the link fail. Avoid using this test configuration in live links.
(c) If connected incorrectly, the test set may loopback both directions of the traffic, which is a condition that could be difficult to identify.
2.2 User Interface Elements
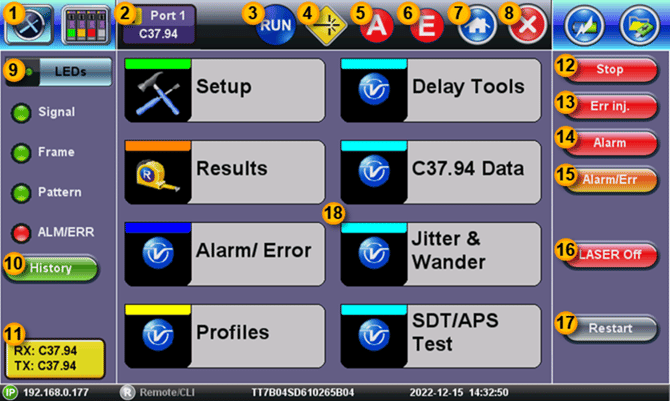
- System Utilities – This soft button provides access to the test platform setting and global functions.
- Test Application – Indicates the active test application currently being displayed. Tap on this soft button to release or change the current Test Mode for this test port.
- Testing – Indicates that a test is currently running.
- Laser Status – Indicates if the transmitter's laser is currently ON or OFF.
- Alarm Generation – Indicates that an alarm is currently being inserted to the transmitted test signal.
- Error Generation – Indicates that errors are currently being injected into the transmitted test signal.
- Home – Goes back to test application's the Main Menu.
- Exit – Goes back to the previous screen or menu level.
- Soft LED indicators – Show a summary of the received test signal health status. Green = good, Red = bad, Blinking = historical event reminder (e.g., reminder of events that happened in the past but are no longer present).
- History – Acknowledges and resets the blinking historical reminder. The soft LEDs go back to display their current status. No events or counters are reset or deleted from the test. In Dual Port mode, Port 1 and Port 2 buttons may be shown below the History button, to allow users to quickly switch between two independent tests. Dual LED columns are also displayed.
- Interface Status – Shows that the test set’s interface is configured to transmit and receive C37.94 signals.
- Start/Stop – This soft button initiates and terminates the BER test. Tests can also be timed, so they automatically stop after a set amount of time.
- Error Injection – Activates and deactivates the error injection function. The type of error and behavior can be programmed using the Alarm/Err button.
- Alarm Generation – Activates and deactivates the alarm generation function. The type of alarm and behavior can be programmed using the Alarm/Err button.
- Alarms & Error Settings – Provides access to the Alarm Generation and Error Injection configuration menu at any time, from any screen.
- Laser ON/OFF – Use this button to turn the test interface laser ON and OFF.
- Restart – Restarts the test, clearing all records and counters, without saving.
- The C37.94 Main Menu items are shown in the center of the screen. Results and Configurations are also shown in this main screen area. The features and layout may vary slightly from product to product.
Note: P1 and P2 refer to Test Port 1 and Test Port 2.
2.3 Physical Buttons
Save: Depending on the test platform being used, press the ![]() or
or ![]() or
or ![]() button on the test set to save the current test results.
button on the test set to save the current test results.
History: The ![]() button has the same effect as the History function. Clears the LED reminders (blinking) and history flags (It does not clear the error or alarm counters).
button has the same effect as the History function. Clears the LED reminders (blinking) and history flags (It does not clear the error or alarm counters).
Lock: Use the ![]() button to temporarily disable the touch screen and prevent accidental changes during unattended or long-term tests. An icon on the top-right corner of the screen will indicate whether the screen lock is enabled or disabled.
button to temporarily disable the touch screen and prevent accidental changes during unattended or long-term tests. An icon on the top-right corner of the screen will indicate whether the screen lock is enabled or disabled.
Capture: The ![]() button can also be temporarily programmed to capture and store screen shots (PNG format). To enable this alternate function, go to >Utilities >Settings >Global >Save Settings, select Save Screen, set desired quality (compression) level and the maximum number of images to store in Files.
button can also be temporarily programmed to capture and store screen shots (PNG format). To enable this alternate function, go to >Utilities >Settings >Global >Save Settings, select Save Screen, set desired quality (compression) level and the maximum number of images to store in Files.
3. Test Configuration (Setup)
3.1 Testing IEEE C37.94 Links and Devices
Fiber optics links or network elements using this simple transmission technology can be verified like regular PDH signals, performing bit error rate tests (BERT), monitoring signal levels, payload errors and alarms.
Important Notes:
- C37.94 Testing is an optional feature (license), and it must be activated in order to have access to its functions.
- The C37.94 optical data rate is very low by today’s standards and not all modern SFPs are compatible with it (most are designed for rates ≥100 Mbit/s). Only use SFPs recommended by VeEX, which are non-blocking and have a clock and data recovery (CDR) capable of working at 2048 kbit/s.
- The output signal of modern 850nm SFP modules is stronger than the original standard teleprotection equipment input range. To avoid saturation or invalid measurements, use an optical loopback cord to measure the actual SFP output power. Then add the appropriate in-line attenuator, in the TX direction, to match network elements’ output, if necessary (e.g., 5 or 10 dB). Although some modern C37.94 equipment can accept higher power inputs, the original IEEE standard refers to a maximum of -11 dBm output at the TX port. The original dynamic range at the RX was defined as -32 to -11 dBm.
- Although C37.94 defines an optical interface operating at 830 ±40 nm over multi-mode fiber (MMF) with BFOC/2.5 (ST) connector, it is not uncommon today to find implementations running at 1310 nm MMF or SMF, for longer reach or to reuse existing SMF fiber used for other telecommunication purposes. Common fiber optics connectors or adapters, other than BFOC, may also be found in the field, such as the Duplex LC offered by SFP transceivers.
3.2 Signal
The C37.94 Test Application uses VeEX’s signature layered test signal configuration user interface, allowing users to build the desired test signal using an intuitive flow chart structure. Tap on each box to have access to all applicable parameters that can be configured.

Hierarchy: No selection. Fixed to C37.94.
Interface: Let users select the Clock Source to be used to drive the optical interface.
- Internal – Uses the test set’s oscillator to generate the TX test signal.
- External – Uses an external reference clock source applied to the CLK input in the connector panel.
- From RX – Uses the clock recovered from the received signal to time the TX test signal.
- Offset – Adds frequency offset to the internal oscillator to stress the far end receiver clock recovery circuits and verify it complies with the minimum ±100 ppm deviation tolerance required by the standard.
Payload: Allow users to configure the TX data rate by entering the number of Nx64 kbit/s data Channels to be used for the test. N can be any integer number between 1 (64 kbit/s) and 12 (768 kbit/s).
If the RX is already connected to the far-end signal, this screen will also show the N value sent by the far end equipment and auto configure the test set’s receiver to match. The Received Channels information can also be used to confirm the N value to be configured in test set’s TX channels.
Pattern: A C37.94 link is a single serial datacom interface and it is always tested with a bulk constant bit rate (CBR) payload carrying a pseudo random bit sequence (PRBS) or test pattern, to identify any data errors.
3.3 Measurement Setup
Select this tab to configure how the BER test behaves. The menu fields will change depending on the selections made.

Mode:
- Manual – User starts and stops the test.
- Timed – Allow users to program the duration of the test. When the set time has elapsed, the test set automatically stops the test.
- Auto – Programmable start time. Users can enter the exact date and time when they want the test to start and its duration. Press the Start button to trigger the function and leave the test set on. Note that no measurements are made until the test starts.
Auto Save: The test set can also be programed to automatically save results at specific intervals. When enabled, users can also select to automatically upload these results to a centralized R300-Server (requires Advanced Management option and R-Server account) or to an FTP server. Requires server login.
Analysis: User can program the hypothetical reference configuration (HRX) allocation to be used for the ITU-T G.821 Pass/Fail performance evaluation.
Three distinct quality levels are defined for an end-to-end path (link); two access links (one at each end) with Local and Medium grade and one long-haul link in the middle with High grade. Local links are allowed 15%, Medium grade are allowed 15% and High grade are allowed 40%, for a total of 100% (Local + Medium + High + Medium + Local). Enter the appropriate allocation depending on the section of the end-to-end path being tested. In practice, users testing complete links usually leave this at 100% block error allocation.
3.4 General Setup
Provides extra configuration parameters applicable to the test.
Audible Alarm: Enables or disables the audible alarm. When enabled the test set buzzer emits a warning tone. This function is test application dependent and not functional in C37.94 test modes.
Results on start: When turned ON, the test set automatically jumps to the Results screen when the Start button is pressed. If set to OFF, user has to manually navigate to the test Results section.

Auto Save: When turned ON, the test set automatically saves the test results when the Stop button is pressed. The file is saved with a temporary name based on the yyyymmdd-hhmmss time stamp format.
Meas. Clock Source: This is a selection for the reference clock that will be used to perform frequency-related measurement on the received signal. Internal mode uses the test set’s crystal oscillator, while TX Clock Source uses the same clock selection set for the transmitter, as configured in >Setup >Signal >Interface.
4. Test Results
In general, the following color coding is used to identify the status.
- Red: Errors or alarms are present.
- Yellow: Errors or alarms have been detected but are no longer present. Also known as History. Users can clear this flag by pressing the History button, so they can monitor from afar if new errors or alarms have been detected since they last checked the test results.
- Green: OK or Good! No errors or alarms have been detected.
4.1 Summary
Shows the overall status of the current test.
- ST: Start Time. Date and time when the test started.
- ET: Elapsed Time. Total time that the current test has been running.
- RT: Remaining Time. During timed tests it indicates how much time is still left before the test stops.
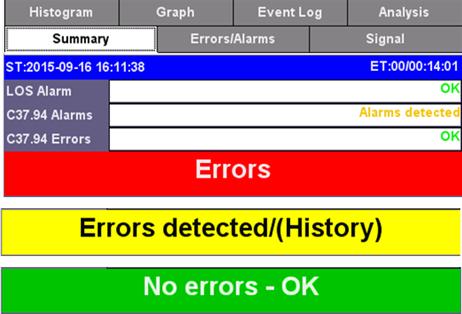
The bottom banner shows the overall status, while the individual fields at the top provide more information about which layers may have been affected.
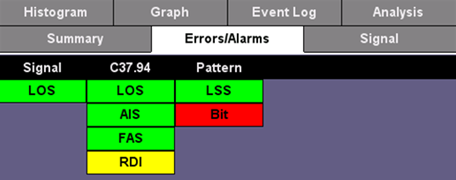
4.2 Errors & Alarms Summary
The first page of this detailed test results report shows a layer-by-layer summary of all Alarms and Errors being monitored. Tap on the individual indicators to quickly access detailed count and rate measurements. The arrow buttons on the bottom can also be used to navigate the results page by page.
4.3 Signal
All physical layer information can be found in this tab.
Level – Received optical power readings as reported by the transceiver. Presented in numerical and graphical format.
Frequency – Received clock measurement and clock offset calculation in parts per million (ppm).
Optical – Displays transceiver related information.
SFP – Graphical display of received power level fluctuations over time.
4.4 Histogram
Shows the sequence of errors and alarms over time. It can be used to correlate intermittent problems to other events (e.g., power loss, storms, vibration, etc.) or identify if the problem is cyclic or random in nature. User can zoom in and zoom out using the [+] and [-] buttons to view the results in hours, minutes or seconds. In zoom mode, use the [<] and [>] icons to navigate the different time windows.

4.5 Graph
Displays the behavior of individual error or alarm in a bar graph format over time. It is used to identify the severity of each event over time to understand its behavior. User can zoom in and zoom out using the [+] and [-] buttons to view the results in hours, minutes or seconds. In zoom mode, use the [<] and [>] icons to navigate the different time windows.
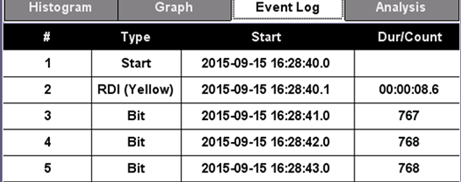
4.7 Event Log
Shows a time-stamped sequence of all events detected during the test, including length or error count for each of the events.
4.8 Analysis
Shows G.821 out-of-service (OOS) BER performance analysis with Pass/Fail evaluation. Errored Second (ES), Severely Errored Seconds (SES), Available Seconds (AS), Unavailable Seconds (UAS), Error Free Seconds (EFS).
5. Other Features and Functions (Main Menu)
5.1 Alarm & Error Generation
Configures the behavior of the Alarm Generation and Error Injection soft buttons.
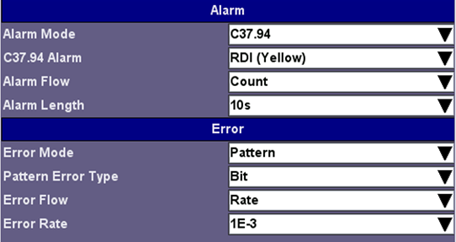
Alarms
- The test set can generate Signal-based LOS, Frame-based LOS, AIS and RDI (Yellow), in Continuous or Count (timed) modes. In timed mode the alarms can be set to last 0.1, 1, 10 or 100 seconds.
Errors:
- Error Mode – The test set can inject errors to the C37.94 framing structure or to the test Pattern.
- Error Type – FAS, Bit
- Error Flow – Determines the behavior of the error injection. It can be set to inject a Single error, a Count or specific number of errors from 1 to 1000, or a continuous error Rate from as low as 1E-9 (1x10⁻⁹) to as high as 1E-3 (1x10⁻³).
5.2 C37.94 Data (Received)
Displays a sampling of the C37.94 raw data being received, including framing bits (yellow), Overhead N bits and their complements (blue) and the overhead preamble bits (light gray), followed by data bits and their respective complements (white). Note that only the active channels’ pair of bytes will update (depending on the N value). Unused channels (two bytes) will display the idle code 10101010 10101010 (FF). This is followed by the user's data, in which every bit in the data channel is encoded as a two-bit physical symbol consisting of the original data bit and its complement (01 or 10). So, a data byte in C37.94 is encoded onto 16 bits of the lower 2.048 kbit/s physical layer.

Use the Pause button to capture 16 consecutive frames.
The Page field at the bottom shows which of the 16 captured frames is currently being displayed. Odd frames show Framing Pattern 1 and even frames show Framing Pattern 2, including the RDI (Yellow) alarm bit. Use the Previous and Next buttons to navigate through the captured frames' data.
5.3 Round Trip Delay (RTD)
With a loopback at the far-end, the test set can measure the time it takes especially marked bits to make the round trip. This measures the total latency (delay) of fiber length in each direction, including active equipment delays. The loopback can be fiber optics, electrical (in case it terminates in a different Datacom or PDH interface) or logical (triggered inside network element or line card).
The test can be configured to run a single measurement, Repeat = OFF, if the total delay is not expected to change over time, or Repeat = ON to run it continuously. When Repeat is enabled, the test set will keep track of the Current (last), Maximum, Minimum and Average values measured. Before starting the measurement, turn the Laser ON and Calibrate it by looping the TX and RX with a patch cord, before measuring the link’s RTD. The measurement resolution is 1 μs.

Round Trip Delay (RTD) or Round Trip Time (RTT) is a popular communication path latency verification tool, due to its simplicity. It only requires one test set and a logical or physical loopback at the far-end. The link delay (cable plus active network elements) can be calculated as RTD/2, assuming that all segments of the link are symmetrical.
That assumption may have been considered true for Datacom, C37.94, PDH, DSn, SDH and SONET (except for certain SDH/SONET ring configurations). Today, with the introduction of packet networks, circuit emulation (or pseudowire) and the encapsulation of legacy streams into Ethernet, the situation may have changed in certain cases, due to the asynchronous nature of Ethernet, Packet Delay Variation (PDV), queuing and buffering.
5.4 One-Way Delay Measurements (OWD) - Latency and Asymmetry
Supported by: TX340s, MTTplus-340, RXT-3400 (and discontinued TX320s, MTTplus-320)
Certain timing-sensitive applications require symmetric data links, so a dual-ended One-Way Delay (OWD) test is required to verify the data latency in each direction of the link. The two test sets used, one at each end (site), require access to an accurate timing reference, aligned with the standard second. This timing source is provided by a 1PPS signal from a GNSS Clock (built-in or external). The rising edge of the one-pulse-per-second signal indicates the beginning of a second everywhere in the world. The 1PPS is used to synchronize the clocks in both test sets.
The OWD test must work with C37.94 bursty behavior (data transmitted every 125μs) and be compatible with any Nx64k data rate (N=1 to 12), network element, multiplexer, DSn, PDH, SDH/SONET or Circuit Emulation (pseudowire, Ethernet) equipment in the path, to achieve meaningful resolution and accuracy.
Important: The one-way delay (OWD) or latency is a point-to-point end-to-end test that requires two synchronized test sets, of the same kind, at each end of the link. Different types of test sets may have different intrinsic internal delays, which are internally compensated for each model, so using different models may introduce errors (offset) in the measurement. Therefore, using the same type of test set and software versions at both ends is required. For example, use two MTTplus-340, one at each side. Using an MTTplus-340 to tests against an older MTTplus-320 will produce erroneous results.
OWD is a coordinated end-to-end test that requires both test sets (and users) to be ready and follow each other’s status over the phone or any other communication mean. Users in sites A and B must have access to:
- A traceable External 1PPS signal (from a GNSS/GPS clock) connected to the test set’s CLK (SMA) input port, or the built-in GNSS Receiver option in the test set and have its antenna installed with unobstructed wide view to the sky and fully locked.
- Both users (sides) must configure the OWD mode and be ready to start.
- The test shall only be started when both test sets are in the OWD measurement mode and ready (confirm with your peer), otherwise, you may have one test set sending pseudorandom sequences (PRBS) that could introduce wrong measurements at the other end.
Note: If the OWD test is being performed by one person who leaves one test set ready and running at Site A and drives to Site B to configure and start the test, then configure the OWD measurement test fully before connection the test set to the link under test at Site B, to avoid random data to be sent to Site A.
For the built-in GNSS receiver, connect the antenna to the SMA connector, go to >System Tools >Utilities >Settings >More >High Precision Clock Source >GNSS, turn GNSS/GPS receiver ON, wait until satellites are detected (at least four with >36 dB-Hz) and the GNSS Status = Lock (the GNSS ![]() icon on the bottom-right of the screen turns green). Notify your partner at the other end of the link and go back to the C37.94 app to begin testing. This is not required if an External 1PPS is used as reference.
icon on the bottom-right of the screen turns green). Notify your partner at the other end of the link and go back to the C37.94 app to begin testing. This is not required if an External 1PPS is used as reference.
If you want to get the maximum 1PPS accuracy and stability available from the GNSS/GPS receiver, set Location Survey = Enabled, Window = 600 s or 300 s, Accuracy = 1 m, enter the exact antenna cable feed delay in the Ant. Delay (ns) field, and select all the GNSS constellations and bands supported by the antenna. Then turn the GNSS Receiver slider button ON and wait until the Site Survey field reads OK and the 3D Deviation is < 1 m. At that point, the test set has the best 1PPS synchronization and you can start the OWD measurement procedure. If the <1 m deviation can't be achieved at the location, you may try 3 m, however, that would be considered a compromise in accuracy.
Network elements and multiplexers may be responsible for a significant share of the latency added to the path (link), with fiber being responsible for adding around 5 μs for every 1000m of cable (1.5 ns/ft). The example diagram below only includes the fiber part of the link, as it is considered the worst-case scenario (shortest delays) and highlights the importance of having enough accuracy and resolution (1μs or better) in order to measure cables’ contribution.
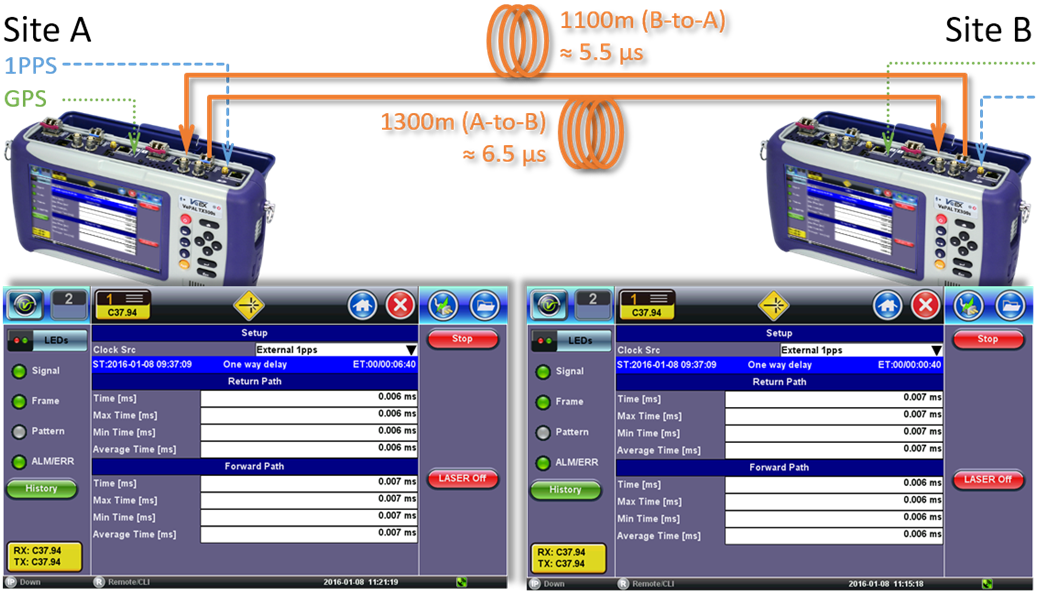
Once both test sets are synchronized to the standard second (1PPS), connect them to their respective local C37.94 ports, turn the laser ON and verify proper end-to-end connectivity (Signal, Frame, Pattern and no errors or alarms).
Enter the One-Way Delay function and confirm with the far-end that they are also in the OWD measurement screen. Press the Start button to start measuring the incoming delay (Return Path) and receiving the outgoing delay from the far end (forward path).
Important: Keep both test sets in the One-Way Delay screen. If one of the test sets leaves the OWD test feature, the other test set may start reporting invalid results. Stop the test and save the results before quitting the OWD application.
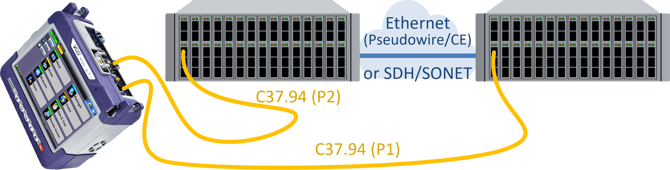
In Dual Port mode, the test set allows running a bi-directional OWD test with only one test set. This is useful for troubleshooting problems in a lab or repair center or fine-tuning network settings when access to both ends of the link in one place. In this application you will have to launch the C37.94 test application in both ports (P1 and P2) and run the One-Way Delay test on both. If you are using local 1PPS reference clocks, you will also need to feed them to CLK A and CLK B, to synchronize both test applications.
5.5 Profiles
Test configurations can be saved and later retrieved using the Test Profiles function.
- To save the current test configuration, tap on the Save As button and use the keypad to give it a name that represents the use case or test scenario for that specific configuration (e.g., site, network element, type of link, data rate, etc.). Press Apply to save.
- To update the current test profile with the current test configuration, open the profile menu and select Save.
- To retrieve a saved test profile, open the profile menu, select the desired test profile from the list and press Load. The setting are immediately copied to the test set.
- To delete a test profile, open the profile menu, select the desired profile from the list and select Delete.
Test profiles can also be managed using the test platform File Manager. Go to >System Tools >Utilities >Files >Saved.
5.6 Jitter and Wander Measurements (optional)
Since the traditional multiplexed TDM networks are being replaced with Ethernet (packets) transport networks (circuit emulation or pseudowire), there has been a renewed interest in C37.94, especially in verifying Jitter and Wander compliance. This is due to the packetization or conversion from C37.94 framed transmission into Ethernet to be transported by the new packet network, which is expected to be seamlessly reconstructed at the far end.
Although the circuit emulation cards or SFP adapters account and compensate for it, the main concern with the packet transport network continues to be the packet delay variation (PDV) which may introduce physical Jitter and/or Wander to the C37.94 signal, depending on the traffic load of the switches. So, people prefer to double-check whether there are significant effects or not.
The Jitter and Wander requirements follow the definitions on the IEEE Std C37.94-2017 standard, which are different than the regular PDH/SDH and no pre-filtering is specified.
-
Maximum Jitter Output (Multiplexer): ±0.1 UI (±50 ns)
-
Maximum Jitter Output (Teleprotection): ±0.2 UI (±100 ns)
-
Receiver's Jitter Tolerance: ±0.2 UI (±100 ns)
- Maximum Wander (Multiplexer): ±0.5 UIpp (±250 ns)
Jitter and Wander measurements are optional features available for some of the test sets. To perform Jitter measurements, launch the C37.94 Testing application, turn the TX Laser ON, then select the >Jitter & Wander >Jitter application. Select the type of Equipment under test, Teleprotection or Multiplexer, for the test set to apply the appropriate limits for Pass (green) and Fail (red) evaluation. Tap on Start to measure.
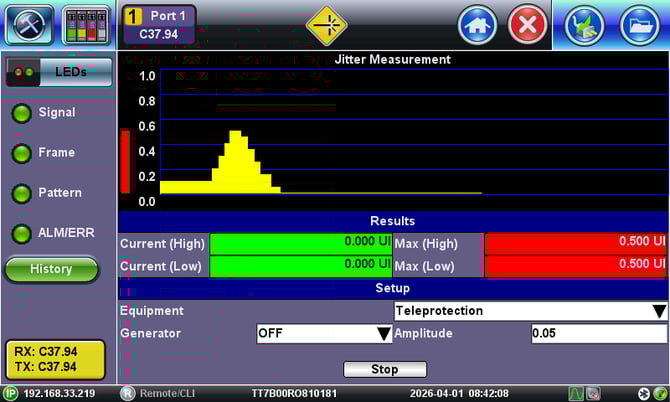
C37.94 jitter is measured separately for logic 1 and logic 0 states. The instrument displays these as Current (High) and Current (Low) values, respectively, along with the Maximum values recorded during the test. If the bits are fully symmetrical and only the fundamental clock frequency is varying, the High and Low jitter readings should be essentially identical. If, instead, the pulse widths themselves are changing (pulses becoming shorter or longer), the two jitter values may differ.
The IEEE C37.94 specification defines jitter measurement using an oscilloscope triggered on either the rising or falling edge of the data signal. In practice, this means the measured period (and therefore the jitter) corresponds to a low (logic “0”) bit when the trigger is set to the falling edge, or a high (logic “1”) bit when the trigger is set to the rising edge. VeEX uses an equivalent approach by displaying both jitter measurements. This enables users to observe and compare any differences in jitter between low and high states.
Users can also turn the jitter Generator ON to stress the device under test with different jitter amplitudes generated by the test set.
-
The test set generates (injects) a high frequency jitter to the physical test signal transmitted, at a fixed frequency (68.2 kHz). Note that the standard makes no recommendations about specific frequencies.
-
Users can set the jitter Amplitude in fractions of UI (unit interval).
Wander measurements require external Primary Reference Clock (PRC) as an accurate and stable frequency reference or the 10 MHz clock signal from the built-in GNSS-disciplined Atomic Clock (hardware options).
5.7 Pass-Through & Monitor Mode
Test sets with dual SFP+ ports may combine P1+P1 to offer an in-line Pass-Through mode, in which the test set acts as a repeater and can monitor alarms and errors. It can also be used to insert Errors or Alarms in either link direction, to test the reaction of the system. If the link under test is carrying a known test pattern, the pass-through test set can be tese to Out of Service = ON mode, to monitor bit errors and BER.

In this mode, the data flows transparently, in the following directions:
-
P1 RX --> P2 TX
-
P1 TX <-- P2 RX
The In-line Pass-Through, also known as “transparent” mode, is an intrusive test that may not be recommended in certain cases for the following reasons:
-
It changes the condition of the link under tests. The signal is regenerated with clean shape and full power, removing the effects from long fiber links, which are common causes of problems in point-to-point optical links.
-
Changing the settings or losing power will make the link fail. Avoid using this test configuration in live links.
-
If connected incorrectly, the test set may loopback both directions of the traffic, which is a condition that could be difficult to identify.
Error & Alarm Injection: This in-line test mode can also be intrusive, by inserting errors or alarms into one direction of the link under test. Besides Signal Loss, Frame Loss, RDI (Yellow) alarms and Frame (FAS) errors, the test set can also insert BIT errors to the live data stream (at the data level).
6. File Manager
Use the >System Tools >Utilities >Files >Saved feature to manage (view, rename, delete, lock) test results, test profiles and captured screen images. Here you can also export and import test results to/from a USB memory stick or create PDF reports (directly saved into the USB memory).
Related Test Solutions
- TX340S - Dual 10G Advanced Multi-Service Test Set
- RXT-3400 - Dual 10G Advanced Multi-Service Test Module
- MTTplus-340 - Dual 10G Multi-Service Test Module
- MTX150 - 10G Multi Service Test Set