

End of Life Notice: The optional IEEE 1588v2/PTP emulation and measurement features entered their End-of-Life stage on 2026-04-30 (last ship date) and are no longer available for newer VeEX test sets. Existing PTP license holders may continue to use the features as-is. Please refer to VeEX's EOL Policy Statement for further details.
1. Getting to Know VeEX's Products & PTP
Note: Information may change from product to product and/or over time due to constant features' evolution.
1.1 Products Supporting IEEE 1588v2 PTP Testing
- TX340s: 1GE, 10GE (References: GNSS, Atomic Clock, External)
- RXT-3400: 1GE, 10GE (References: GNSS, Atomic Clock, External)
- RXT-6200: 1GE, 10GE, 25GE (References: GNSS, Atomic Clock, External)
1.2 Available Reference Clocks
- External Clock Sources: 1PPS, 1.544 MHz, 2.048 MHz, 10 MHz, 1.544 Mbps, 2.048 Mbps
- Built-in GNSS Receiver (optional): 1PPS (unfiltered)
- Quad-constellation GNSS Receiver hardware option, supporting GPS L1C/A, GLONASS L1OF, Galileo E1B/C, and BeiDou B1.
- Quad-constellation Multi-band GNSS Receiver hardware option, supporting GPS L1C/A & L2C, GLONASS L1OF & L2OF, Galileo E1B/C & E5b, BeiDou B1I & B2I.
- Optional antennas required (depending on the choice of receiver)
- Built-in Atomic Clock (optional): GNSS-disciplined 1PPS, 10 MHz
Optional built-in atomic clock not available for the MTTplus platform or TX340s with two factory-installed test modules.
1.3 Related Software Licenses
The following software licenses may be required for the features, options and test functionalities described in this document.
- Z33-00-052 1GE SyncE Bundle
- 499-05-559 1GE SyncE ESMC/SSM Message Support
- 499-05-576 1GE SyncE Master and Slave Emulation
- 499-05-578 SyncE and IEEE1588v2 Wander Analysis
- Z33-00-053 10GE SyncE Bundle
- 499-05-593 10GE SyncE Master and Slave Emulation
- 499-05-594 10GE SyncE ESMC/SSM Message Support
- Z33-00-054 1GE IEEE1588v2 Bundle
- 499-05-572 1GE IEEE1588v2 IPv4 Master Emulation
- 499-05-573 1GE IEEE1588v2 IPv6 Support
- 499-05-574 1GE IEEE1588v2 Protocol Decode
- 499-05-575 IEEE1588v2 Measurements (PDV, etc.) - Slave mode only
- 499-05-578 SyncE and IEEE1588v2 Wander Analysis
- 499-05-663 IEEE1588v2/PTP Pass Through and PDV Analysis
- 499-05-571 1GE IEEE1588v2 IPv4 Slave Emulation
- 499-05-814 10GE IEEE1588v2, incl. IPv4/IPv6, Master/Slave Emulation, Protocol Decode, Slave Mode PDV Analysis and Wander Analysis
- Z33-00-042 Wander Analysis Package, incl. Built-in TIE Logging/Export, TIE, MTIE/TDEV Post Analysis
- 499-05-196 Wander TIE logging and export for MTIE/TDEV Post Analysis
- 499-05-621 Built-in MTIE/TDEV Wander Analysis
- 499-05-622 Physical Clock Wander and Phase Measurements
1.4 Brief PTP Basics
Precision Time Protocol (PTP) uses a simple process that allows the Slave Clock to calculate the difference in time between the Grandmaster (reference) and the Slave. It is based on the assumption that the link is symmetrical, and the packet delay is the same in both directions of communications, and that it remains fairly constant. The left side shows the simplified process (concept) used to calculate the Offset (error) and correct it. The two-step example below is based on the Telecom profiles with end-to-end (E2E) delay measurement.
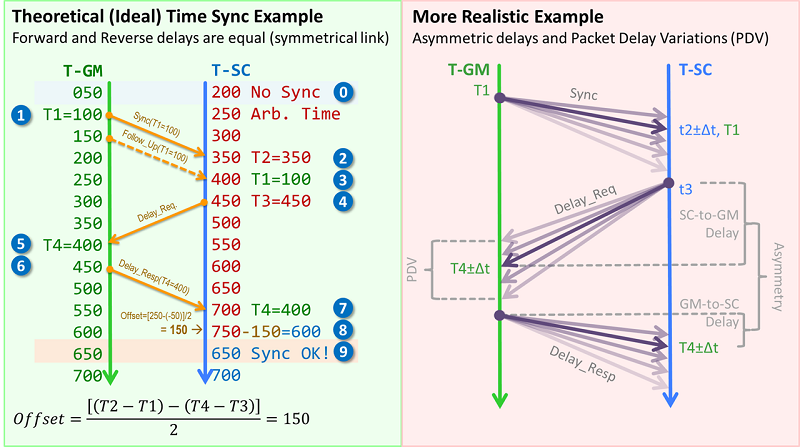
In reality, there are some constant delays and asymmetry caused by the medium, as well as phase noise generated by active elements (switches, buffers), traffic and temperature changes, among others, that cause packet jitter and PDV, which are a bit more difficult to work with.
FYI
T1 is the Sync message departure timestamp, from the GM port. In one-step clocks the timestamp is carried by the Sync Message itself. In two-step clocks the time stamp is carried by a FollowUp message.
T2 is the Sync message arrival timestamp at the test equipment or SC port.
T3 is the DelayRequest departure timestamp, from the test equipment or SC port.
T4 is the DelayRequest arrival timestamp at the GM port. Its value is sent back to the test equipment or SC in the DelayResponse messages.
Offset calculations are used to correct any Time Error at the SC, so it stays in sync with the GM, with the assumption that forward and reverse delays are symmetrical.
Offset = [(T2-T1)-(T4-T3)]/2
1.5 Simultaneous SyncE+PTP Operation
The test set may allow for SyncE and IEEE 1588v2/PTP features to run concurrently. To configure SyncE operation refer to the SyncE section.
The test set may allow the following tests combinations:
- SyncE Master + IEEE 1588v2/PTP Master mode simultaneous operation.
- SyncE Slave + IEEE 1588v2/PTP Slave mode simultaneous operation.
2. Configuring the Test Application
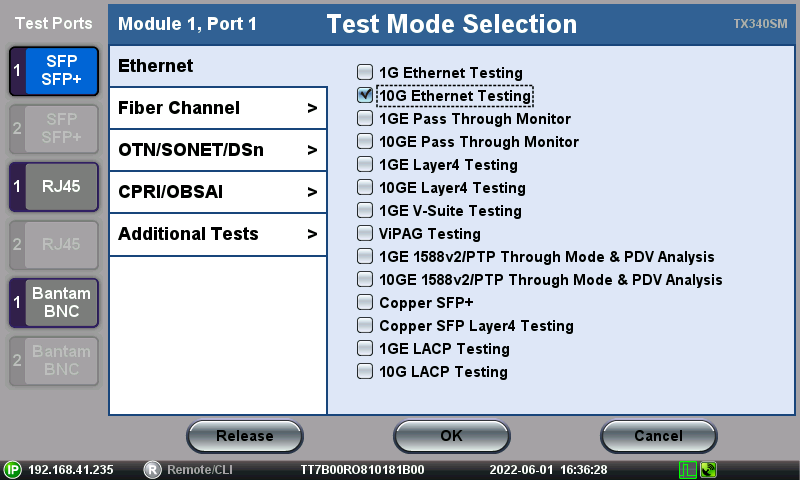
2.1 Launching the IEEE1588v2/PTP Test Feature
- Select an available Test Port Group
- Select SFP+/SFP or RJ45 Test Port
- Select the Ethernet test mode tab
- Select 1G Ethernet Testing or 10G Ethernet Testing feature
- Tap on the OK button to launch the test main application and wait for it to load
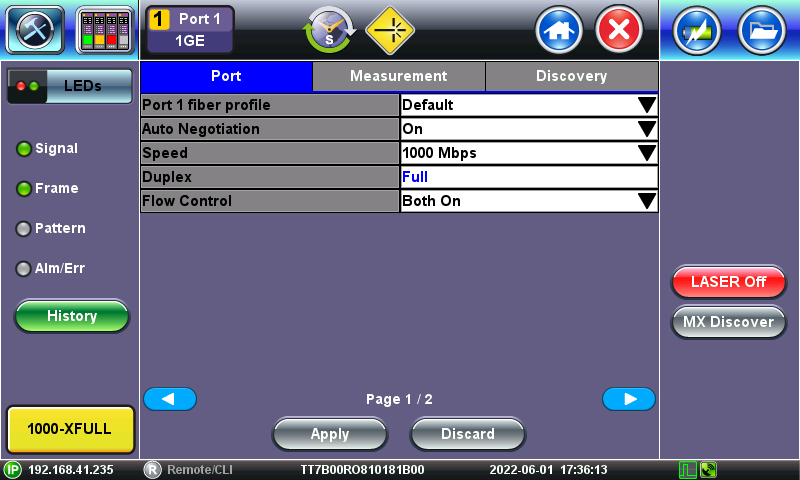
2.2 Configuring Synchronous Ethernet (SyncE)
If SyncE physical layer synchronization is required, it must be configured first
- Tap on the Setup menu item
- Use the arrow icons to go to Page 2 and set Synchronous Ethernet to Enabled

- Set the Emulation Mode to Slave or Master (must match the desired PTP emulation)
- Select the desired Measurement Reference Clock source, based on the traceable Primary Reference Clocks (PRC) or Primary Reference Time Clocks PRTCs available.
- If an external precision clock source is available, a one-pulse-per-second 1PPS is required for Time Error (TE) measurements. Connect the cable from the external clock (PRTC) to the CLK IN SMA A or 1 (for Port Group 1) or SMA B or 2 (for Port Group 2)
- If no external reference clock sources are available, the use of the Atomic 1PPS from the (optional) built-in GNSS-disciplined Atomic Clock 1PPS signal is recommended. Read the article in the following link for more details on how to configure and Disciplining the Internal Atomic Clock to provide a precise, accurate and stable timing signal, or follow the video link.
- If the (optional) built-in GNSS receiver is the only traceable clock source available, select GPS 1PPS. Note that this includes some short-term noise inherent to GNSS signals and that will affect the Time Error (TE) measurements and calculations. Read the article in the following link for more details on how to configure the GNSS Receiver and the required survey process, or follow the video link.
-
For information about Precision timing GNSS Receivers, follow the video link.
- If any other clock format (besides 1PPS) is selected, the test set will work on the Frequency Synchronization only mode (wander and TIE), since no traceable time reference would be available. This applies to 1.544 MHz, 2.048 MHz, 10 MHz, 1.544 Mbps, 2.048 Mbps or any other supported frequency source.
- Set the Recovered Clock Output to None.
- Optionally the Recovered Clock Output field can be configured to take a copy of the clock reference clock and make it available at the Tx1 BNC port (or CLK OUT 1/2 SMA). This is mostly used for demonstration and training purposes, but not recommended for time or phase testing, due to some added delays. To enable, select the desired clock format and set the related parameters for it.
- Press Apply to save the configuration.
- Connect the test port to the Device Under Test (DUT), Link Under Test or Port Under Test. If it is an optical port, press the Laser ON button and confirm the yellow laser status icon on the top of the screen.
- Also check for the rectangular yellow status indicator at the bottom-left of the screen to confirm a Layer 2 connection has been successfully stablished.
- At the Top of the screen, a semi-circular green arrow indicates that the SyncE frequency synchronization has been stablished.
- Tap on the red round (X) button to go back to the Main Menu
- Tap on the Advanced Tools menu item, then on the ESMC SSM, set the SSM Code to match the required Clock Quality indication for the test set. If the test set is being driven by a trusted accurate and traceable reference clock signal, it is suggested to set it to QL-EEC1/SEC.
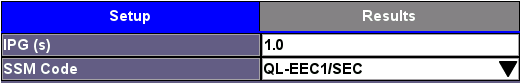
- Press Start so the test set begins announcing its clock quality status. A table with couther of transmitted and received clock quality messages is displayed. The test set should have successfully stablished a SyncE link connection.
- Tap on the red round (X) button to go back to the Advanced Tools menu.
2.3 Configuring PTP Slave Emulation
- In the Advanced Tools menu, select 1588v2/PTP.
- First, set 1588v2 Profile to the required standard profile, from the available list. This will populate the rest of the configuration fields with appropriate default/common values you can adjust later. To measure Time Error (TE) in modern telecom time profile, select G.8275.1.
- ITU-T G.8275.1 Precision Time Protocol (PTP) Telecom profile for Phase/Time synchronization with Full Timing Support (FTS) from the network
- ITU-T G.8275.2 Precision Time Protocol (PTP) Telecom profile for Time/Phase synchronization with Partial Timing Support (PTS) from the network
- ITU-T G.8265.1 Precision Time Protocol (PTP) Telecom profile for Frequency synchronization
- IEEE/IEC 61850-9-3 Precision Time Protocol (PTP) profile for power utility automation
- IEEE C37.238 Precision Time Protocol in Power System Applications
- IEEE 802.1as PTP profile for LAN/MAN Timing Sensitive Networks (also known as gPTP or IEC 60802)
- IEEE SMPTE ST 2059-2 Profile for Use of IEEE-1588 Precision Time Protocol in Professional Broadcast Applications
- AES67 AES standard for audio applications of networks - High-performance streaming audio-over-IP interoperability
- Select the Clock Mode to emulate the Slave clock (time client) side. If SyncE was previously configured, this field would already be set to match the SyncE settings. Time Error (TE) measurements are only available in Slave clock emulation mode.
- Enter the Domain Number to match the target grandmaster (GM) or boundary clock (BC).
The following setting fields are automatically set for most common applications (based on the Profile selected). Nonetheless users can modify them to fit the application, keeping in mind that the test set allows complete flexibility, so knowledge of PTP standards is required.
- Delay Mechanism: End-to-End (E2E) or Peer-to-Peer (P2P) path delay calculation method.
- E2E: End-to-end measurement (Delay_Req, Delay_Resp) over Layer 2 or 3 IP (Internet Protocol). PTP telecom profiles primarily utilize the E2E (End-to-End) delay mechanism. Specifically, the PTP Telecom, PTP Enterprise, and PTP G.8275.1 profiles all use E2E.
- P2P: Peer-to-peer measurement (Pdelay_Req, Pdelay_Resp) over Layer 2 IEEE 802.3 Ethernet links. PTP Power profiles utilize P2P.
- Protocol Mode: Layer 2, Layer3 IPv4 UDP, or Layer 3 IPv6 UDP protocol encapsulation. For Layer 3 applications, users must configure and stablish a valid IP connection through the selected Test Port, using the IP configuration menu.
- Transfer Mode: If configured as Layer 3, select Unicast or Multicast to match the IPv4 or IPv6 network environment.
- Master IP: If configured as Layer 3 Unicast, enter the IP address of the Grandmaster.
- VLAN: OFF (no VLAN) or 1 VLAN tag (ID and Priority).
- Master Clock ID: Received from the Grandmaster (GM). This field gets automatically populated once the emulation is started.
- Slave Clock ID: Automatically assigned to the Slave Clock (SC). This field gets populated once the emulation is started.
- GM Clock Class: Received from the Grandmaster (GM). This field gets automatically populated once the emulation is started. Some examples of clock classes are:
-
6 T‐GM Locked to a PRTC synchronized to PTP/TAI timescale from a PRTC (for example, traceable to GNSS)
-
7 T‐GM in Holdover (previously synchronized to PRTC), within holdover specification
- 13 T‐GM locked to an application specific (arbitrary) timescale
- 14 T-GM in Holdover (previously synchronized to an arbitrary timescale reference), within holdover specification
-
135 T‐BC in Holdover, within holdover specification
-
140 T‐GM in Holdover, out of holdover specification
-
150 T‐GM in Holdover, out of holdover specification
-
160 T‐GM in Holdover, out of holdover specification
-
165 T‐BC in Holdover, out of holdover specification
-
248 T‐GM or T‐BC Without time reference since start‐up
-
255 T‐TSC Slave only Ordinary Clock (OC)
-
- Sync Rate: If configured as Layer 3 Unicast, select the Sync messages rate to match the settings in the Grandmaster.
- Announce Interval: Periodicity of the Announce messages sent by the Slave clock.
- DelayReq Rate: If set to Layer 3 IPv4 Unicast, set the required DelayRequest messages rate sent by the Slave clock.
- Destination MAC: In Precision Time Protocol (PTP), two types of multicast MAC addresses are used: Forwardable and Non-forwardable. Packets with Forwardable MAC 01-1B-19-00-00-00 are standard in LAN/WAN and forwarded by switches, while Non-forwardable MAC 01-80-C2-00-00-0E are reserved and not forwarded switches. For example, if the network is made of PTP aware switches, like boundary clocks, a non-forwardable MAC can be used since the PTP packets only go from one network element to the next.
- Adaptive Negotiations: If set to Layer 3 Unicast, users can turn it OFF or ON.
- OFF (default) - Uses the configuration set by the user and/or the profile selected.
- ON - The test set uses the content from Grandmaster’s signaling messages to overwrite local settings. That is, the actual message rates for Sync, Announce, DelayRequest are adjusted to match the Grandmaster's and may be different to what users manually configured. Use this for configuration troubleshooting purposes only, in case connection is not being established.
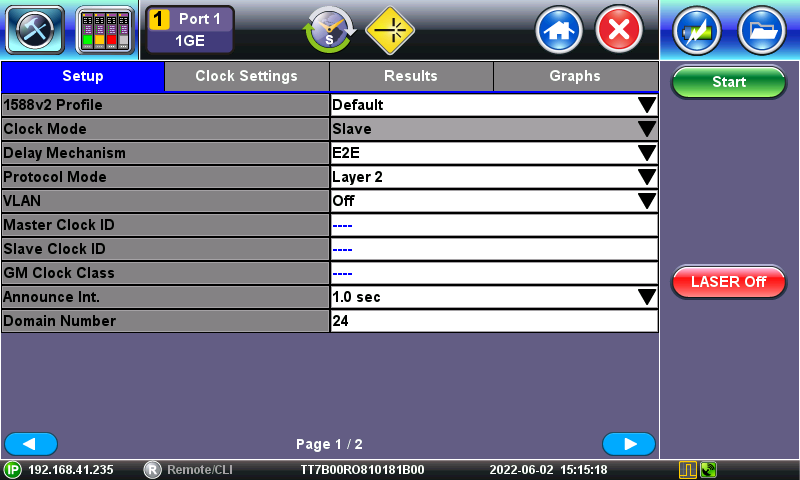
Example of a Layer 2 configuration screen
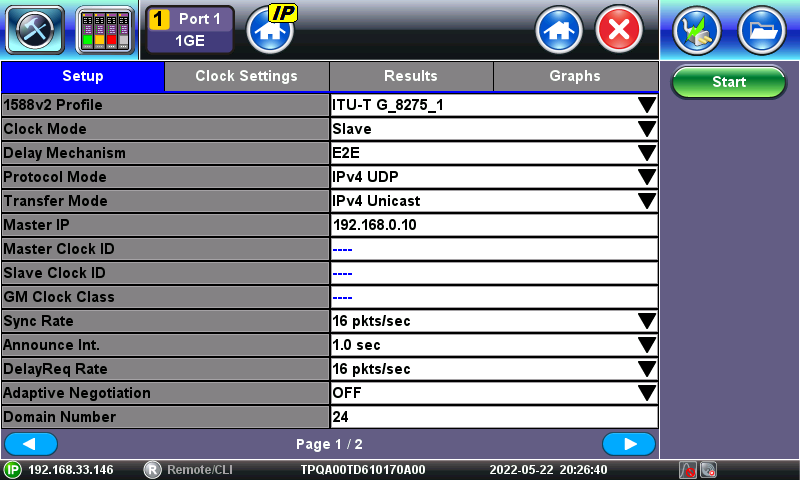
Example of a Layer 3 (IP) Slave configuration screen
Use the arrow icons to turn to Page 2, to configure the Time Error (TE) measurement parameters. The Measurement Reference Clock must be a traceable 1PPS aligned to the standard second and in sync with the 1PPS being used by the Grandmaster clock.
- BC-TE Delay Measurement: Enables or disables the packet-based Time Error measurements and calculations. When turned ON, the following parameters can be configured by users.

- Forward TE1 Threshold: If enabled, users can specify the maximum amount allowed for the Forward Time Error. It is the Sync messages timestamp difference from GM (T1) to SC (T2). If the value is greater than the threshold, it gets recorded in the events table. Keep in mind that this threshold is relative to the average total link delay between the GM and SC, so it should be set accordingly. TE1 = T1 - T2
- Reverse TE4 Threshold: If enabled, users can specify the maximum amount allowed for the Reverse Time Error. It is the DelayReq messages timestamp difference from SC (T3) to GM (T4). If the value is greater than the threshold, it gets recorded in the events table. Keep in mind that this threshold is relative to the average total link delay between the SC and GM, so it should be set accordingly. TE4 = T4 - T3
- 2Way TE Threshold: If enabled, users can specify the maximum amount allowed for the 2Way Time Error calculation. If the value is greater than the threshold, it gets recorded in the events table. 2WayTE = (TE1 + TE4)/2
- Forward Cable Delay Compensation: When testing next to a Grandmaster (GM), Boundary Clock (BC) or Transparent Clock (TC), to verify packet timing accuracy, it may not be possible or practical to make the measurements right at their output ports. Short patch cords (cables) need to be used to connect the test set with the device under test, but those cables introduce a constant delay (4~5 ns/m). Enter the amount of delay introduced by the cable, from GM to the test set, to remove its effect from the calculations and analysis.
- Reverse Cable Delay Compensation: When testing next to a Grandmaster (GM), Boundary Clock (BC) or Transparent Clock (TC), to verify packet timing accuracy, it may not be possible or practical to make the measurements right at their output ports. Short patch cords (cables) need to be used to connect the test set with the device under test, but those cables introduce a constant delay (4~5ns/m). Enter the amount of delay introduced by the cable, from test set to the GM, to remove its effect from the calculations and analysis.
- cTE Averaging Window: The Mean Time Error, commonly known as Contant Time Error (cTE), is calculated from multiple packet measurements over a period of time (sliding window). The recommended calculation window for controlled environments with constant temperature is 1000 seconds (e.g., labs). For variable temperature environments the standards mention 10000 seconds (e.g., field). The first cTE result will be made available after the first window is completed.
- TE Filtering (0.1Hz LPF): When testing Class D equipment (e.g., GM) the standard recommends filtering the Time Error data with a 0.1Hz low-pass filter, before evaluating their performance against the applicable standard masks.
- dTE Filtering (0.1Hz LPF): The Dynamic Time Error is the variable component of TE. The data must be filtered by a 0.1Hz low-pass filter, so it is recommended to turn this ON.
FYI
TE or Time Error measures the time difference between two clocks, one device under test (DUT) and a reference.
TE = Tdut - Tref
Also, TE is considered to have a constant (cTE) and a variable (dTE) component.
TE = cTE + dTE
Once the configuration has been finished press the Start button to initiate the Slave emulation and packet-based Time Error measurements.

Go to the Graphs tab to see the timing results or select the Results tab to see numeric and protocol information.
2.4 Configuring PTP Quasi-Slave Emulation
This legacy test mode is no longer recommended. It is not available in SyncE+PTP mode.
Due to network PDV, Packet-based timing signals are not always stationary or Gaussian in nature. Methods of quantifying them, in order to get an estimation of their ability to carry timing information requires selecting a subset of their entire population. This is done by performing packets pre-filtering before MTIE/TDEV clock stability measurement. The Quasi-slave mode uses G.8260 defined filters to pre-select incoming PTP packets in order to measure Slave Wander on filtered packets.
Quasi-slave mode provides an estimation of the achievable performance of a PTP network Slave.
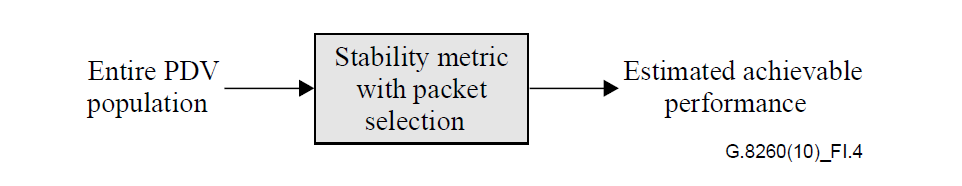
Source ITU-T G.8260
2.4.1 Setup
The setup is similar to the Slave emulation mode, except that there is a third configuration page to manually set up the filtering method.
2.4.2 Quasi-slave mode ITU-T G.8260 filter options
Packet selection filtering is done before performing MTIE/TDEV clock stability measurement. ITU-T G.8260 standard provides filters that are applied on 1588v2//PTP packets.- Filter Method: Minimum, Maximum, and Percentile as defined in ITU-T G.8260
- Percentile: Filtering between configurable Min % and Max % values
- Filter Window Selection: Overlap or Non-Overlap
- Filter Window Length: Configurable from 10 seconds to 7200 seconds. High filter length is recommended for networks with high PDV.
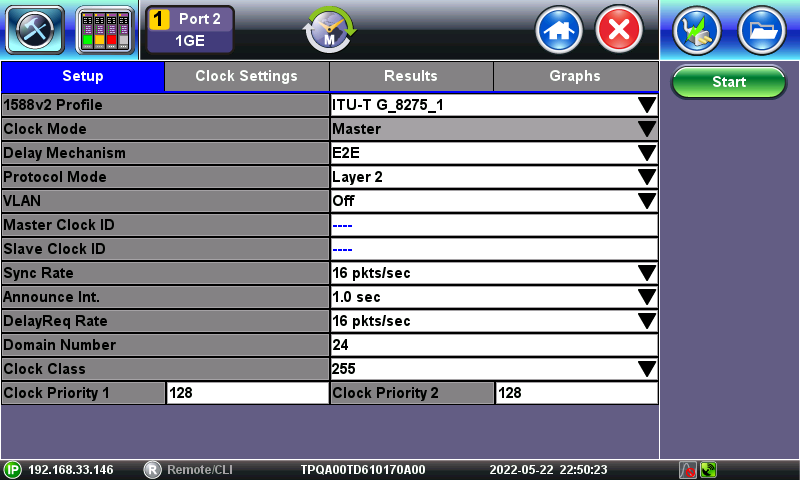
2.5 Configuring PTP Master Emulation
Refer to the Slave Emulation section for detailed information. The test set is by no means a true Grandmaster. This functionality is offered for quick SC health check verifications, troubleshooting, experimenting and training purposes.
- In the Advanced Tools menu, select 1588v2/PTP.
- Set 1588v2 Profile to the required standard profile, from the available list. This will populate the rest of the configuration fields with the appropriate default values. To measure Time Error (TE) in modern telecom time profile, select G.8275.1.
- ITU-T G.8275.1 Precision Time Protocol (PTP) Telecom profile for Phase/Time synchronization with Full Timing Support (FTS) from the network
- ITU-T G.8275.2 Precision Time Protocol (PTP) Telecom profile for Time/Phase synchronization with Partial Timing Support (PTS) from the network
- ITU-T G.8265.1 Precision Time Protocol (PTP) Telecom profile for Frequency synchronization
- IEEE/IEC 61850-9-3 Precision Time Protocol (PTP) profile for power utility automation
- IEEE C37.238 Precision Time Protocol in Power System Applications
- IEEE 802.1as PTP profile for LAN/MAN Timing Sensitive Networks (also known as gPTP or IEC 60802)
- IEEE SMPTE ST 2059-2 Profile for Use of IEEE-1588 Precision Time Protocol in Professional Broadcast Applications
- AES67 AES standard for audio applications of networks - High-performance streaming audio-over-IP interoperability
- Select the Clock Mode to emulate the Master (time server) side. If SyncE was previously configured, this field would already be set to match the SyncE settings. Time Error (TE) measurements are not available in this emulation mode.
- Delay Mechanism: End-to-End (E2E) or Peer-to-Peer (P2P) path delay calculation method.
- Layer 3 E2E: End-to-end measurement (Delay_Req, Delay_Resp) over Layer 3 IP (Internet Protocol).
- Layer 2 P2P: Peer-to-peer measurement (Pdelay_Req, Pdelay_Resp) over Layer 2 IEEE 802.3 Ethernet links.
- Protocol Mode: Layer 2, Layer3 IPv4 UDP, or Layer 3 IPv6 UDP protocol encapsulation. For Layer 3 applications, users must configure and stablish a valid IP connection through the selected Test Port, using the IP configuration menu.
- Transfer Mode: If configures as Layer 3, select Unicast or Multicast to match the IPv4 or IPv6 network environment.
- Master IP: If configured as Layer 3 Unicast, enter the IP address of the Grandmaster.
- VLAN: OFF (no VLAN) or 1 VLAN tag (ID and Priority).
- Master Clock ID: Automatically assigned to the Grandmaster (GM) emulation function. This field gets automatically populated once the emulation is started.
- Slave Clock ID: Received from the Slave Clock (SC). This field gets populated once the emulation is started and the SC is detected.
- Sync Rate: If configured as Layer 3 Unicast, select the Sync messages rate to match the settings in the Grandmaster.
- Announce Interval: Periodicity of the Announce messages sent by the Slave clock.
- DelayReq Rate: If set to Layer 3 Unicast, set the required DelayRequest messages rate sent by the Slave clock.
- Domain Number: Enter the applicable value to match the target network environment.
- GM Clock Class: Enter the applicable clock class for the GM emulation function, based on the timing reference source being used to drive this test set. Some examples of clock classes are:
-
6 T‐GM Locked to a PRTC synchronized to PTP/TAI timescale from a PRTC (for example, traceable to GNSS)
-
7 T‐GM in Holdover (previously synchronized to PRTC), within holdover specification
- 13 T‐GM locked to an application specific (arbitrary) timescale
- 14 T-GM in Holdover (previously synchronized to an arbitrary timescale reference), within holdover specification
- 140 T‐GM in Holdover, out of holdover specification
-
150 T‐GM in Holdover, out of holdover specification
-
160 T‐GM in Holdover, out of holdover specification
- 248 T‐GM without time reference since start‐up
-
- Clock Priority 1: Enter the desired clock priority value.
- Clock Priority 2: Enter the desired clock priority value.
Once the configuration has been finished press the Start button to initiate the Master emulation.

Go to the Results tab to see numeric and protocol information.
3. Measurement Results
3.1 The Results Tab
3.1.1 Summary
These two pages show the total count for Events and General messages on Page 1, as well as detailed, lost, errored, out-of-sequence, undefined messages, per individual message on Page 2.

3.1.2 Messages
Displays the current Rate and Count for all the PTP messages that have been sent and received, since the test started.
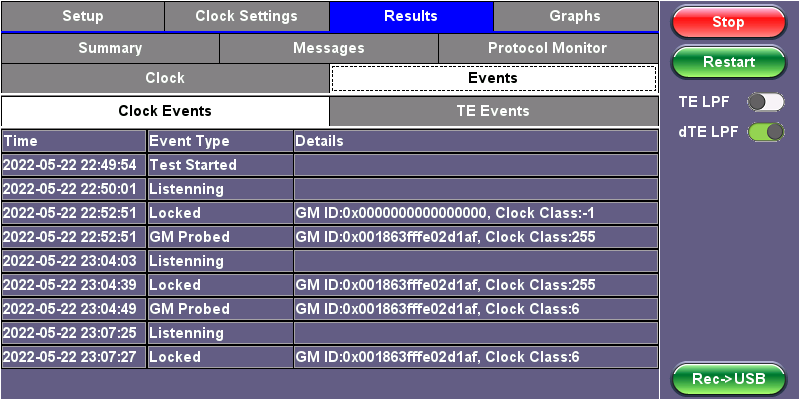
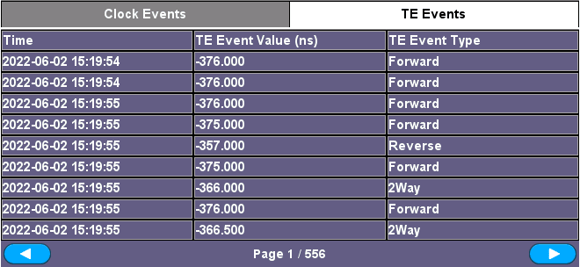
3.1.3 Events (Slave only)
Logs events that occurred during the test. The Clock Events table shows protocol handshake and the TE Events table shows Time Error threshold violation.
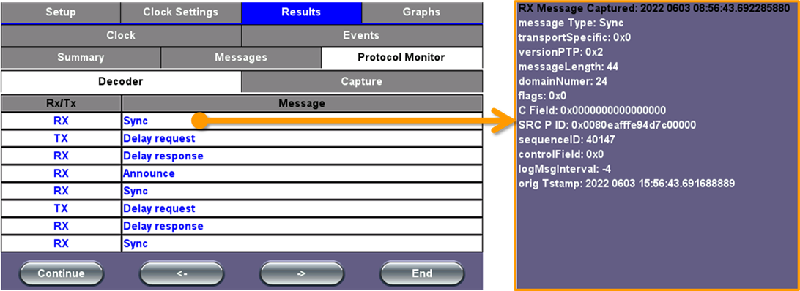
3.1.4 Protocol Monitor (Decoder)
This basic run-time PTP message monitor shows a sampling of the messages being transmitted and received. Users can Pause it, use the <-- and --> to navigate through the messages currently in the buffer, and tap on the desired line item to see its decoding of its basic PTP information. Then use the red (X) button to return.
3.1.5 Protocol Monitor (Capture)
Use this sub-tab to capture PTP messages and save them in standard PCAP format, for further detailed decoding and troubleshooting. Press Start to initiate the recording, Stop when enough messages have been captured, and Save to store the PCAP file in memory.
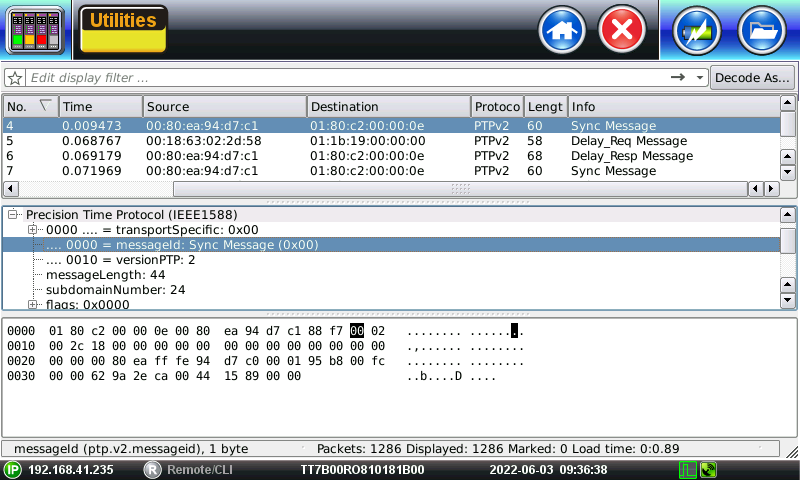
The PCAP files will be available in File Manager (>System Utilities >Files >Saved), to view using the built-in Protocol Analyzer (select the desired PCAP file and press View) or to export them to USB memory stick for further analysis with PC-based protocol analyzers (e.g., Wireshark).
3.1.5 Clock (Slave only)
Basic frequency deviation measurement from the recovered clock (compared to the available reference), provided in parts-per-million (ppm), with maximum and minimum values observed.
3.2 Graphs (Packet Timing)
Displays different types of packet timing measurements in graphical format for quick visual check and basic trend analysis. For example, to check packet-oriented Time Error (TE), link delays or identify potential asymmetry, among others.
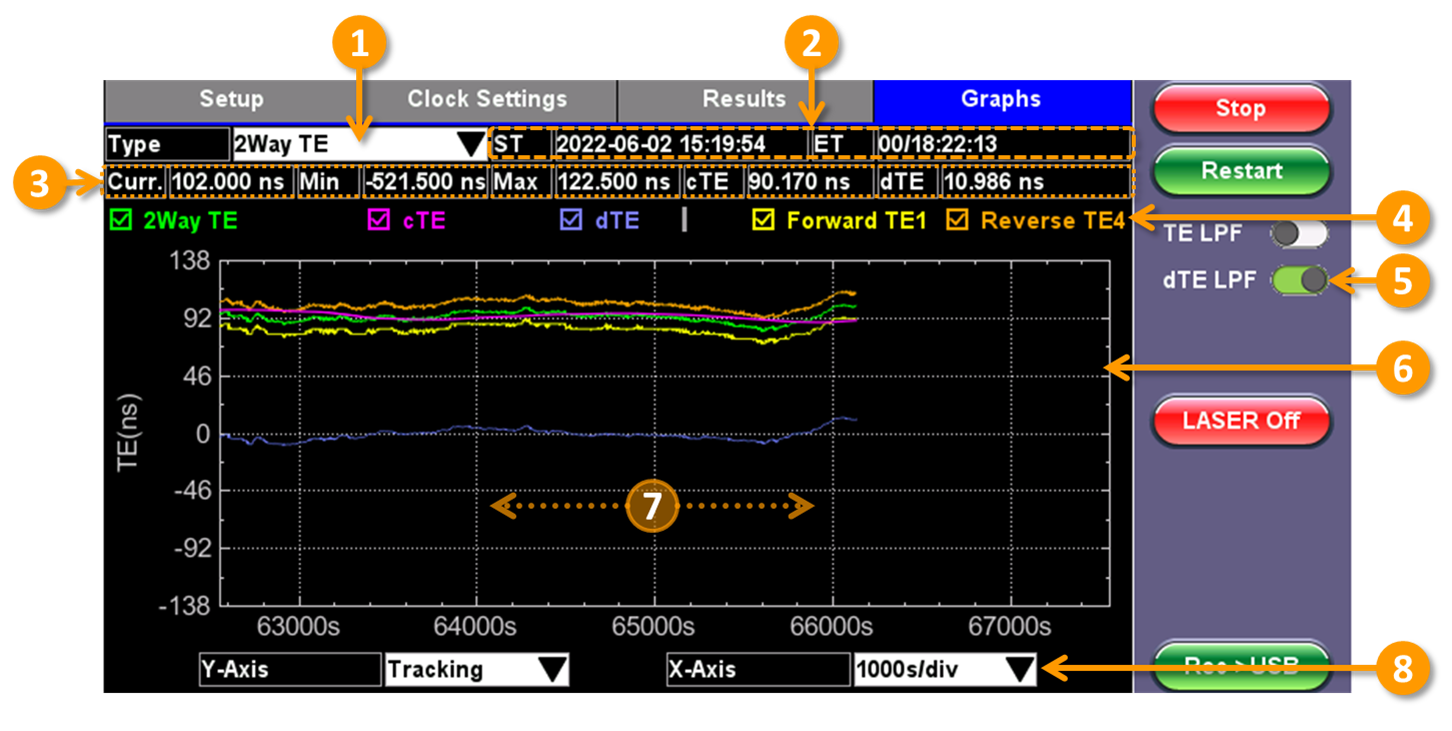
- Select the Type of packet timing parameter to display results for: 2Way TE, Forward TE1, Reverse TE4, Sync PDV, Delay Request PDV, Asymmetry PDV, Round Trip PDV, Delay Response RTD, Sync IPG, Delay Response IPG.
- Displays the Start Time (ST) timestamp with YYYY-MM-DD hh:mm:ss format and the total test time or Elapsed Time (ET) with dd/hh:mm:ss format.
- Measured values for the selected type, indicating Current (Curr), Minimum (Min) and Maximum (Max) measured values. For time-oriented parameters, the mean time error (cTE) and dynamic Time Error (dTE) calculations are also shown, if a 1PPS clock reference is being used for the measurements and the BC-TE Delay Measurement mode has been enabled.
- Use the check boxes to select the related graphs to display on the screen, for comparison or correlation purposes. Note that the graph's Y-axis will auto-scale, based on the value ranges of all selected parameters.
- Indicators of whether the TE and/or dTE data is being filtered with a 0.1Hz low-pass filter.
- Graph display area. The test set stores and displays the last 10000s (02:46:40) worth of data. Users requiring longer term analysis can use the Record-to-USB function.
- Users can tap and swipe (drag) the screen to the right, to move the viewing window in time (previous events, within the 10000s recording). Note that there may be a delay in response, since the test set gives the highest priority to all the complex real-time measurements and analysis it is performing simultaneously.
- X-axis (time) scale selection. The Y-axis is always in tracking mode (auto-scale and auto-centering) to provide the best view possible for the current data.
3.3 The Rec->USB Button (Record TE Data to USB Memory Stick)
Pressing this button allow users to select one packet-based Time Error or timing parameter to record in an open CSV format for further analysis (e.g., 2Way TE).
- Insert a FAT32 USB Memory Stick on any USB port available in the test set.
- Press the Rec->USB button, select the parameter Type to record, tap on the FileName, edit or enter the desired file name, and press OK to start the recording.
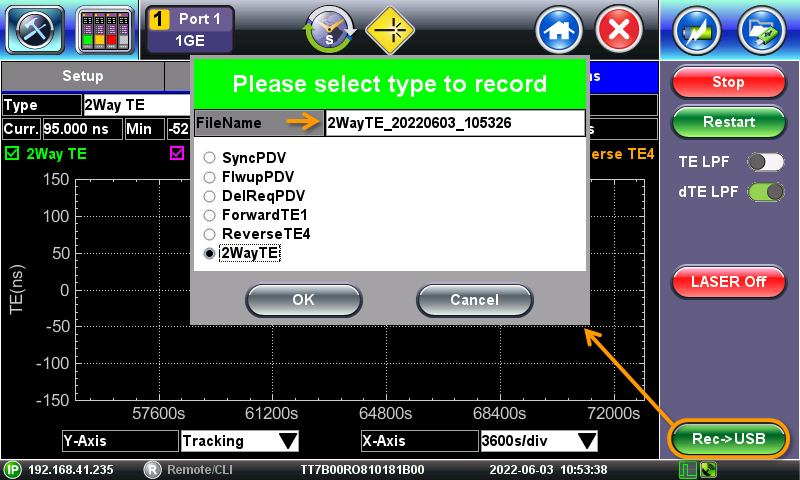
- The recording will take place in the background. Users can continue to navigate through the results.
- Press the now red Recording button to stop the data recording. The CSV file is saved into the USB memory.
Note: Different products and/or software versions may handle the data recording storage differently. Some versions may not require the additional external USB Memory Stick, instead write directly to the test set's internal storage. For those products, the resulting CSV file would be located in the File Manager. From there, it can be selected and exported to a USB memory stick by tapping on the To USB button.
The resulting CSV file can be analyzed using VeEX's Wander Analysis PC Software or it can be exported or modified to be analyzed by more advanced third-party analysis tools. The data format is shown below.
VeEX Inc.                 VePAL TX340S
S/N                       TT7B00RO810181B
SW Version                tx300s-Release-4.0.8
Test Type                 PTP Timing
Reference Clock           ATOMIC 1PPS
Test Signal               2Way TE
Start Time                2022/06/03 10:53:58

Time(s)                   TIE(ns)
0                         95
0.062641                  95
0.125118                  95
0.188591                  95
    ¦                     ¦
496.061403                98.5
496.123891                98.5
End TIE Data
End Time                  2022/06/03 11:02:14
Primary-ET                496 s
Primary-Total Sampling    7939
Primary-Sampling Interval 16/s
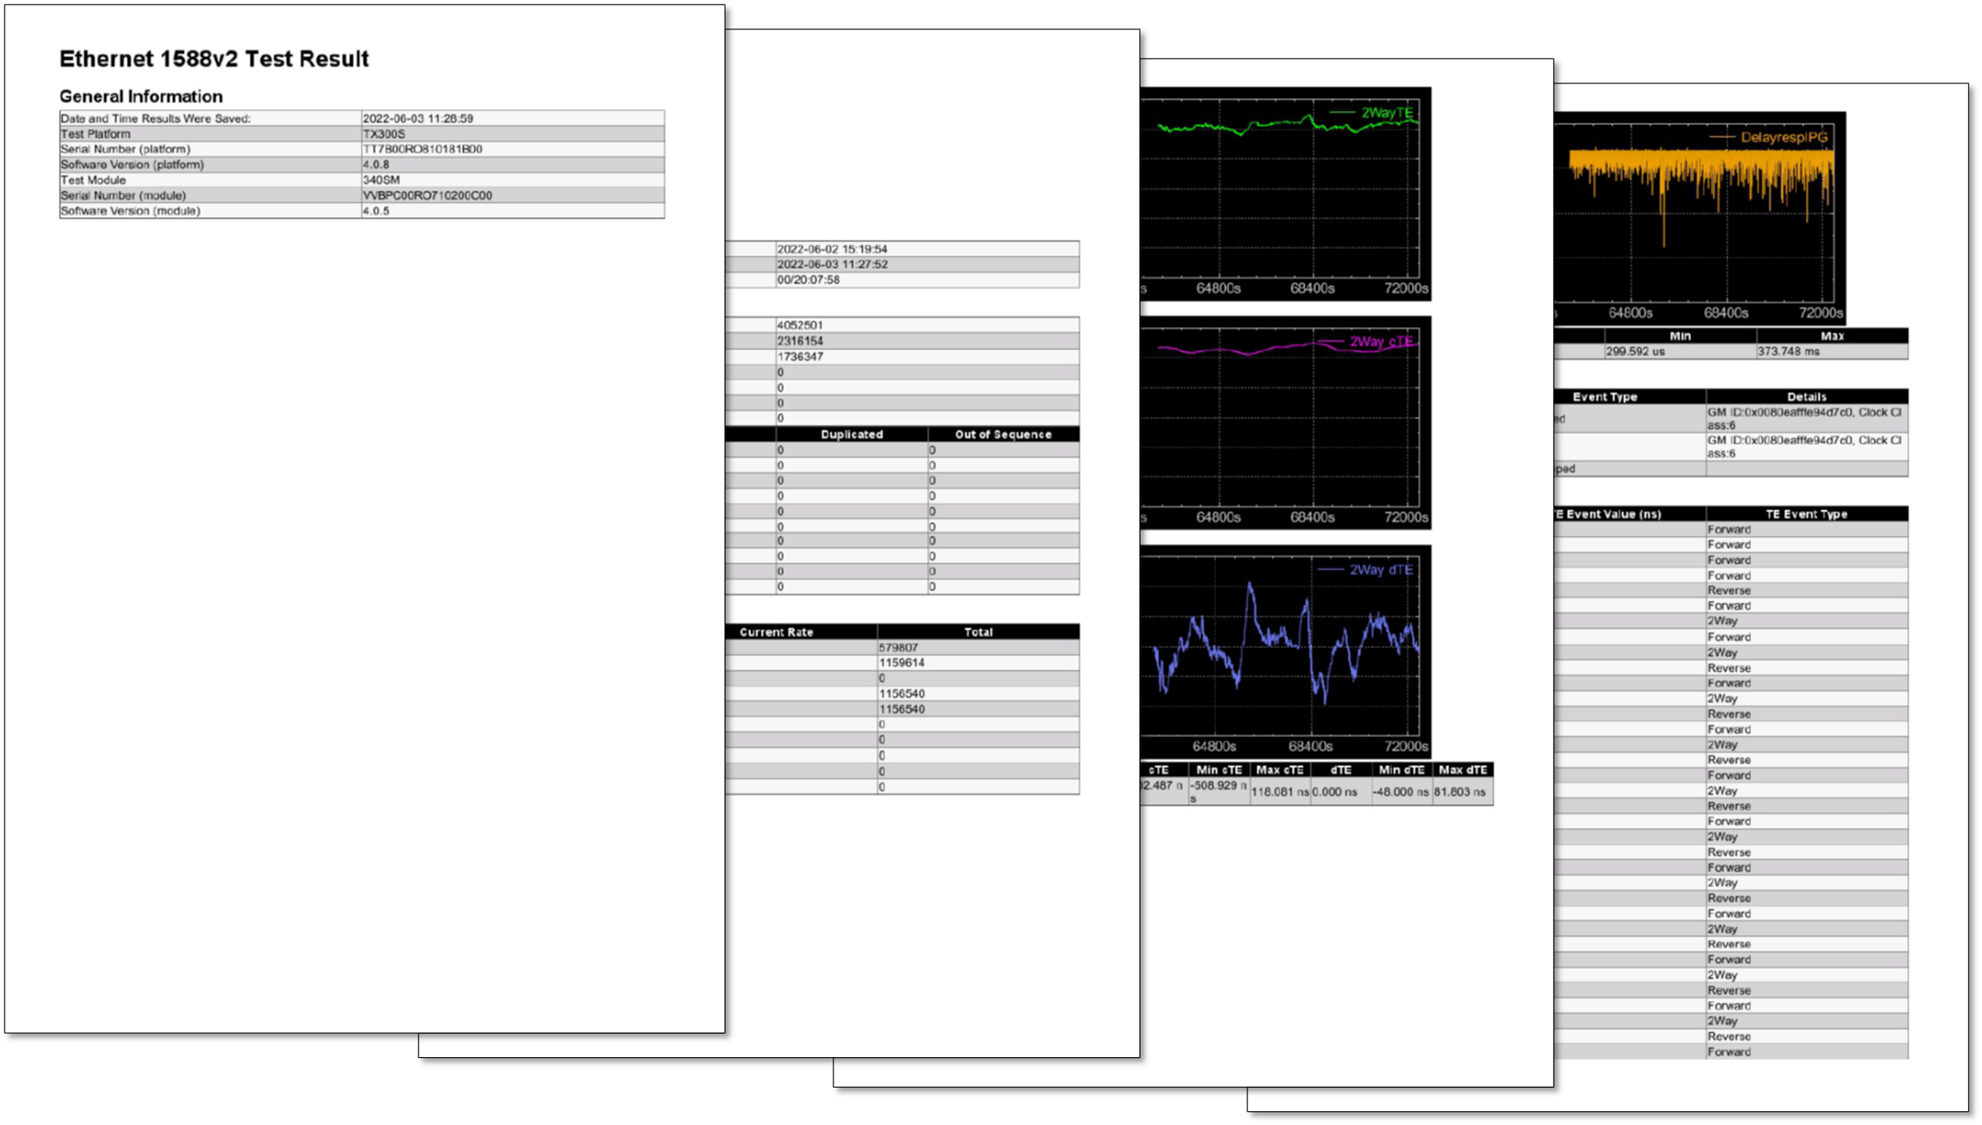
3.4 Stopping and Saving Results (Test Report)
Once finished with the test, press the red Stop button to terminate the measurements and protocol emulation. Once stopped, the results (counter, events and graphs) can be saved by pressing the physical Folder (Save) button on the test set and enter the desired name. The resulting test report will be available in the File Manager. They can be exported to USB memory in HTML5 (To USB icon) and/or PDF (PDF icon) formats.
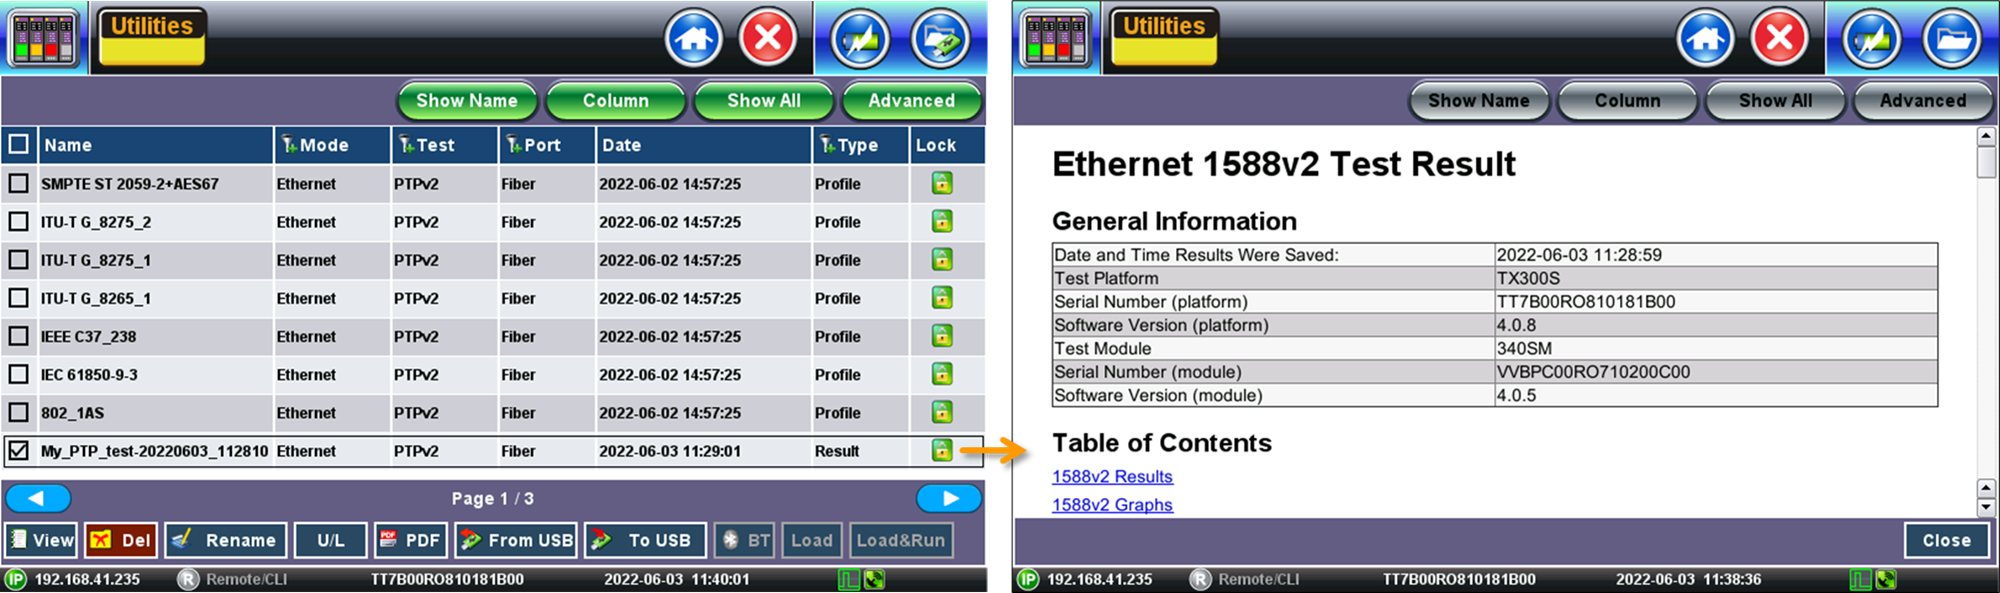
The Restart button resets all the measurements, without stopping the Slave emulation process.
4. 1588v2/PTP Wander Measurements
The wander measurements in the IEEE 1588v2/PTP section are specific to 1588v2 Slave modes. Make sure that a PTP sync has been established to the selected GM and enough "warm up" time has been given to the protocol to provide an accurate and stable recovered clock (test signal).
Wander measurements is used in the context of PTP packet time performance, to track and evaluate short-term and long-term stability (wander) and accuracy. The Time Error (TE) measurements are based on the raw 1PPS clock recovered from the PTP session, without being filtered or stabilized by a precision oscillator.
For telecom Time Error verification applications, it is recommended to use the Slave mode with G.8275.1 or G.8275.2 profiles and 1PPS reference clock from an accurate and stable external clock source (PRTC) or use the internal GNSS-disciplined Atomic 1PPS (although not recommended, the raw GNSS 1PPS reference signal could also be used for long-term stability and accuracy, if nothing else is available, but this will introduce small amounts of short-term and long-term phase noise to the results).
After configuring, starting the PTP Slave emulation and getting proper sync to the remote Grandmaster, go to >Advanced Tools >Wander Measurement feature.
4.1 Setup
- Wander Test Type: Pre-set based on Slave configuration
- Sync Ethernet Clock - When in SyncE+PTP mode the wander function measures the frequency accuracy and stability of the clock recovered from the SyncE link.
- 1588v2/PTP Clock - When the test set is emulating PTP only (no SyncE) and it is operating in TE measurement mode, with 1PPS reference, it measures the accuracy and stability of the raw 1PPS recovered from the PTP protocol engine.
- Measurement Clock Reference: Atomic 1PPS, GPS 1PPS, External 1PPS (pre-set based on Slave configuration)
- Test Mode: Manual, Timed
- Manual - User manually stops the test using the Stop button.
- Timed - User can pre-set the total Duration of the test in Days, Hours, Minutes or Seconds. The test will automatically stop once the programmed time has elapsed.
- Save TIE to USB: Disabled, Enabled (requires the TIE Logging & Export license or Wander Analysis Package.
- Disabled - Presents the current real time TIE measurements on screen only.
- Enabled - Sends real time TIE measurements to an attached FAT32 USB memory stick, for further post analysis (refer to the MTIE and TDEV Analysis section). This feature requires the MTIE and TDEV Post Analysis license (option). Tap on the File field to enter the file name for the wander data file.
- Sampling Rate: For time-oriented PTP, this field stays pre-set to one TIE sample per second, since the reference clock is 1PPS.
Press the Start button to run the test. If Save TIE to USB is enabled, the test set asks for a file name (keep this into account when running time-sensitive tests). Do not remove the USB memory stick while the wander test is running.
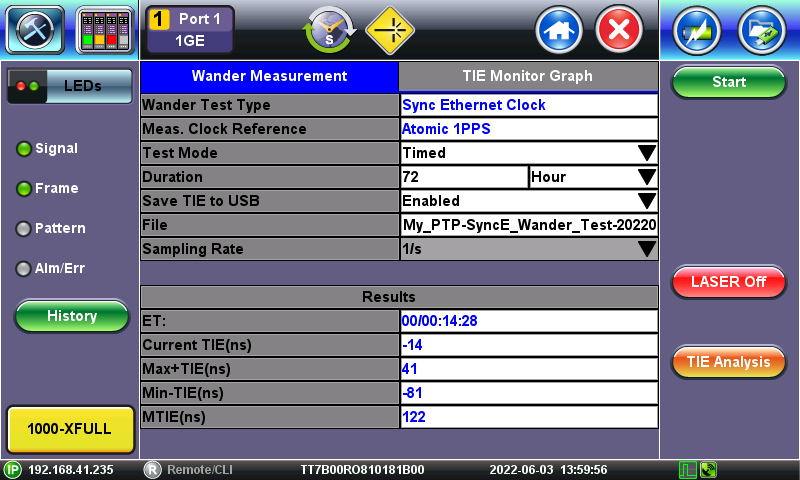
4.2 Results
- ET: Elapsed Time or total test time, in DD/hh:mm:ss format.
- Current TIE (ns): Shows the last Time Interval Error (relative phase error) measured between the reference clock and the test signal.
- Max TIE (ns): Records the maximum TIE value observed since the test was started.
- Min TIE (ns): Records the minimum TIE value observed since the test was started.
- MTIE (ns): Shows the maximum difference between TIE values measured since the test started (Max - Min).
The wander tests will automatically stop if either of the signals used as reference clock or recovered clock (test signal) have significant levels of impairments, are lost, or disconnected.
Press the Stop button to terminate the test. If Save TIE to USB is set to ON, then remove the USB memory stick from the test set, bring it to a computer, and open it with the VeEX Wander Analysis PC software. For further MTIE, TDEV, and masks analysis (refer to the optional Built-in MTIE & TDEV Analysis feature).
Both Wander Analysis and MTIE/TDEV Post Analysis are optional features.
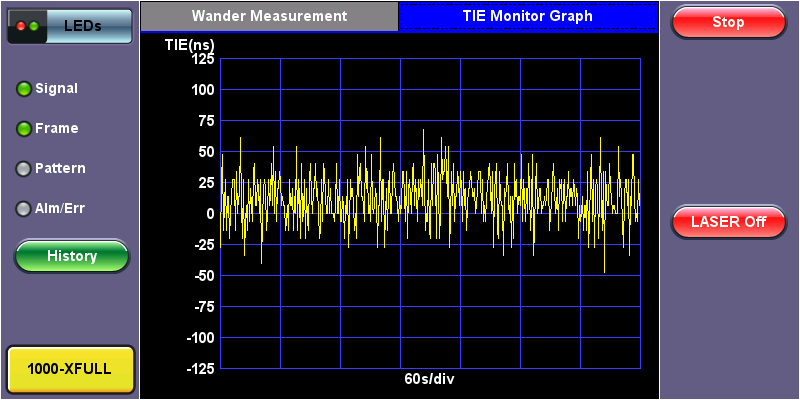
4.3 TIE Monitor Graph
This graph give user a quick view of the last seven minutes of TIE data, to verify that everything is going as expected (configured and connected correctly), before letting the long-term test go for multiple hours or days.
4.4 MTIE & TDEV Post Analysis
This feature requires the Built-in MTIE/TDEV Wander Analysis license or Wander Analysis Package.
Whether the TE or TIE data were stored in the test set internal memory or external USB memory stick, after stopping the wander measurement, users can press the TIE Analysis button to perform post-analysis of the wander data.
4.4.1 TIE Analysis
By default, this screen shows a complete view of all the TIE or TE data captured, so users can visually identify short-term, long-term stability issues, frequency offset (ramp) and other characteristics.

- Start Time: in YYYY-MM-DD hh:mm:ss format
- Total (s): Total measurement time, in seconds
- Frequency Offset (ppm): Frequency error calculated from all the samples and presented in parts-per-million. When the frequency of the recovered clock is accurate (compared to the reference clock), the graph has a flat horizontal trend.
- Start (s): Marks the beginning of the data presented on the graph. Users can change this value, to focus (zoom in) on specific areas of the sampled data, by entering the desired number (in seconds) on this field and pressing the Set Range button.
- End (s): Marks the end of the data presented on the graph. Users can change this value, to focus (zoom in) on specific areas of the sampled data, by entering the desired number (in seconds) on this field and pressing the Set Range button.
- Remove Offset: No, Yes. Users may select to mathematically remove the effects of constant frequency offset from the data, to obtain Relative TIE.
- Marker: Tapping on the graph brings up the red crosshair markers. Users can tap on different areas of the graph to bring up specific datapoints. Use the < and > buttons to fine-tuning the marker position, sample by sample.
4.4.2 MTIE & TDEV Analysis
Performs MTIE and/or TDEV analysis on the selected TIE or TE data range, and compares it against standard masks, providing PASS or FAIL verdicts.
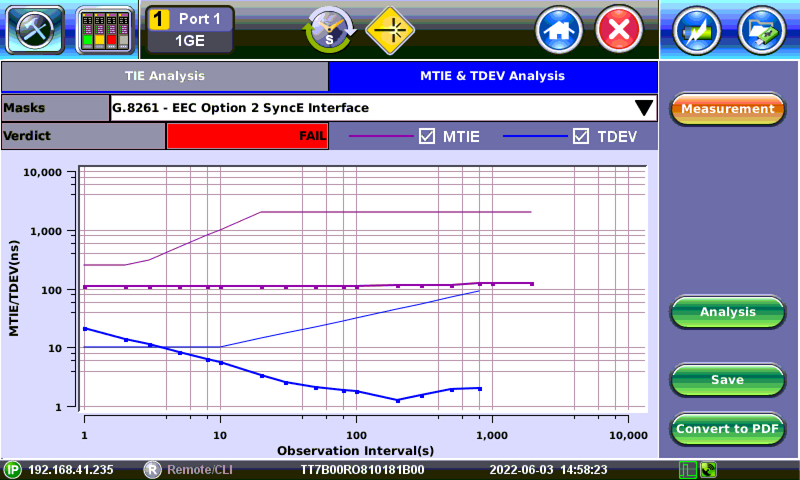
The Save button generates a CSV file with MTIE and/or TDEV datapoints (including the masks) and saves it in the USB memory stick (same folder as the raw TIE data), so users can recreate the graph with a spreadsheet program.
The Convert to PDF button generates a simple report (text and graphs) and saves it in the USB memory stick (same folder as the raw TIE data), so users can immediately share it, without requiring any external PC software. Nonetheless, for better presentation, the VeEX Wander Analysis PC Software is recommended. For more details about the post-processing software, follow the link.
The VeEX Wander Analysis PC Software offers more detailed analysis, reports, exports, and access to more standard masks.
Use the Measurement button to return to the Wander Measurement screen.
| End of Life Notice: The optional IEEE 1588v2/PTP emulation and measurement features entered their End-of-Life stage on 2026-04-30 (last ship date) and are no longer available for newer VeEX test sets. Please refer to VeEX's EOL Policy Statement for further details. |
Related Content
Related Products
- TX340s: Multi-service Test Set - 1GE, 10GE (References: GNSS, Atomic Clock, External)
- RXT-3400: Multi-service Test Module - 1GE, 10GE (References: GNSS, Atomic Clock, External)
- RXT-6200: Advanced 100G Multi-service Test Module (2md Gen.) - 1GE, 10GE (References: GNSS, Atomic Clock, External)
- Wander Analysis PC Software - Simple Wander post-processing application, with standard and user definable mask