
NoApp® is a Registered Trademark of VeEX Inc. Its methods and procedures are protected under US Patents 12,190,199 B1 (QR code) and 12,321,807 B1 (NFC)
1. Introduction
Robust and ubiquitous Quick Response (QR) codes and contactless NFC transmission are revolutionizing the way we transfer test results data, by allowing users to quickly and easily access information without the need for physical copies, cumbersome cables, application installation, configurations or (sometimes unreliable or banned/restricted) paired wireless connections. By simply using a smartphone or any other smart device equipped with a camera and QR code reader or NFC functionality, VeEX users can simply scan the code to instantly access test results' key performance indicators (KPI) through VeEX's patent pending NoApp® cloud service (the basic service is available free of charge, no registration required).
Since QR and NFC are natively supported by modern mobile devices, like smartphones, tablets and laptops. No recurrent IT approvals, no custom application (App) installation, no registration and no constant release updates are required for the everchanging iOS, Android, Windows or Mac ecosystems. The direct contactless and connectionless peer-to-peer data transfer is secure.
With this innovative application of the solid QR and NFC technologies, the NoApp solution provides an always ready-to-use, up-to-date, contact-less, connectionless, secured, fast, simple and efficient test results data transfer, report generation and sharing platform. No preparation, settings or installation required!
A growing number of small VeEX meters and advanced test sets are supporting the NoApp QR or NFC Test Results transfer, due to their simplicity and practicality. In some test sets, the native QR generation just needs to be enabled in the settings.
- No App installation required, no constant updates or recurrent version approvals by IT needed.
- Secure. No connection, registration or subscriptions required.
- Works with any modern smartphone, tablet or PC camera supporting native QR code scanning.
- Just point the camera to the QR code generated by the test set, tap on the link, and the formatted report immediately appears.
- The test KPIs encoded into the QR code or NFC chip can't be altered or manipulated. It is all secure.
- Users can augment the test report information by adding logo, company information, Job ID, location's GPS coordinates, comments, pictures, documents, etc.
- Multiple tests reports, from the same or different testers, can be combined into a single report. For example, a PON Internet access activation may require some optical power measurements at the drop, an optical fault locator measurement to verify the length of the drop, a PON signal analysis test, and an Internet speed test to verify the QoE. Since they all belong to the same job, with NoApp, they can be assembled and filed on a single comprehensive report.
- Users can generate PDF reports on the spot, to store locally or immediately share with the customer or their supervisors via Email. Test results can also be shared via Text Messages (SMS).
- Users can also upload test results to centralized data collection and analysis platforms, like VeEX's VeSion® R-Server. Customers can also integrate it to their systems using the open JSON data structure format.
2. How to Use the NoApp® Contactless Transfer?
2.1 Using QR Codes
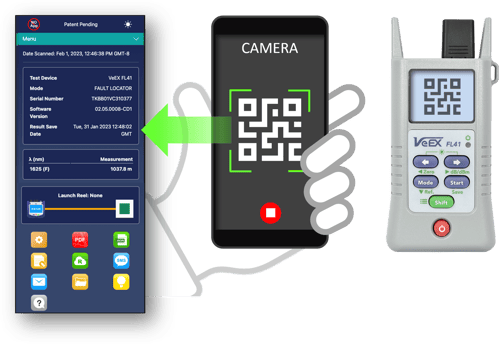
It is so Simple! Just point the smartphone (tablet or PC) camera towards the QR code displayed on the test set's screen and tap on the link. Done.
First, check if the meter or test set supports QR Results. Visit the Resources section on the product's web page and Release Notes, to check if new SW versions are available.
If QR Results are supported, you may need to enable it. Once enabled, run a supported test and save the results. The QR code may be displayed in the process of saving the results or it can be generated from the File Manager, by tapping on the ![]() QR icon or dedicated QR button (depending on the tester being used).
QR icon or dedicated QR button (depending on the tester being used).

Use a smartphone, tablet or PC camera to scan the QR code and the test report immediately appears in the default web browser. Internet connectivity is required (e.g., Wi-Fi, LTE, 5G, etc.).
Once the test report is displayed, users can add company information, logo, job ID, geolocation, comments, picture, other test results, etc. R-Server users can upload the results directly to the centralized/cloud server. Users can also generate PDFs or share the results using email or SMS. It is that simple!
2.2 Using NFC Wireless Transfer
![]() For test sets supporting Near Field Communications (NFC), just save the test results and bring the top of a modern smartphone close to the instrument's NFC logo. An NFC website notification should immediately appear. Tap on the pop-up message to access the test report. Click on the images below for a quick demonstration. (Internet connection is required on the smartphone.)
For test sets supporting Near Field Communications (NFC), just save the test results and bring the top of a modern smartphone close to the instrument's NFC logo. An NFC website notification should immediately appear. Tap on the pop-up message to access the test report. Click on the images below for a quick demonstration. (Internet connection is required on the smartphone.)


3. Features & Functions
![]() Add site's Geolocation coordinates and company logo (if applicable).
Add site's Geolocation coordinates and company logo (if applicable).
![]() Add extra job-related information to the report (e.g., Job ID, technician's information, comments, pictures, etc.).
Add extra job-related information to the report (e.g., Job ID, technician's information, comments, pictures, etc.).
![]() Project: Combine multiple test results into a single job report.
Project: Combine multiple test results into a single job report.
![]() Upload test result KPIs to R-Server (for R-Server users).
Upload test result KPIs to R-Server (for R-Server users).
![]() Share current test report via email.
Share current test report via email.
![]() Share current test report via SMS/MMS messaging.
Share current test report via SMS/MMS messaging.
![]() Generate complete report in PDF format.
Generate complete report in PDF format.
![]() Export to JSON format, for third-party integration or processing.
Export to JSON format, for third-party integration or processing.
![]() Access Quick Guides & Knowledge Base.
Access Quick Guides & Knowledge Base.
![]() Product (test set) information and resources.
Product (test set) information and resources.
4. Basic Requirements
- Meters and/or test sets supporting VeEX's NoApp QR Code generation or built-in NFC transceiver.
- Camera app with QR Code Reader function or NFC functionality*
- Standard web browser*
- Internet connection (cellular or Wi-Fi)*
*Readily available features in modern smartphones, tablets and laptops.
5. NoApp QR Test Report Transfer Examples
How fast and simpler could it be? You can just try it out by yourself, by scanning the QR codes on the following samples.
Example A: Optical Power Meter (OPM) Results from FX41xT
On the left, the FX41xT Terminated Selective PON Optical Power Meter (OPM) is displaying its simple measurement results on its LCD screen. To its right, the same results in NoApp QR format, and the augmented version (as seen on a smartphone), ready to be shared via email, text, or converted to PDF reports. Use a smartphone or tablet to scan the QR code below, to see the NoApp test report.

Note that neither of those advanced reporting features were originally available on the small optical power meter itself, nor supported by its hardware. The addition of the NoApp QR elevates the functionality, usefulness and value of those small meters to a whole new level!
Example B: V-TEST Internet Access Speed Test from an FX120 XGS-PON Analyzer & Multi-Gigabit Internet QoE Test Set
For saved results, go to >System Tools >File Manager, identify the desired speed test result, and tap on its ![]() QR code icon.
QR code icon.

If the QR generation setting is turned ON, the QR code will automatically appear as soon as new tests are saved.
Use a smartphone or tablet to scan the code shown above, to see the NoApp test report and its functionality.
Example C: XGS-PON Test from FX120-Lite XGS-PON Analyzer
Use a smartphone or tablet to scan the QR code below, to see the NoApp test report.

6. How Much Information Can a QR Code Carry?
In general, it depends on the QR code size (class), error correction level, the number of dots (blocks) used, and the size and resolution of the screen. Also, the URLs used by NoApp have a total character limit too. However, VeEX's NoApp uses efficient encoding techniques to optimize the data, which allows for complete reports to be generated by the NoApp web/cloud service. Here is one example of an Internet access speed test results, after being decoded and formatted by NoApp.

7. Supported Products and Test Results
FX120 (QR)
- OPM (optical power level measurements)
- ONT Emulation
- Speed Tests
- OTDR
- Fault Locator
- Fiber Scope
MTX150X/Lite (QR)
- Speed Tests
PX90 (NFC & QR)
- OPM (optical power level measurements)
- Ookla Speedtest
- iPerf Speed Test
FX92 (NFC & QR)
- DWDM C-band channel scan
FL41, FX41xT, FX81T, FX80 (QR).
Related Test Solutions
- NoApp® - Product Page
- PX90 - GPON & XGS-PON Service Installation Meter
- FX92 - DWDM C-band Optical Channel Checker
- FX120 Lite - GPON & XGS-PON Analyzer
- FX120 - GPON & XGS-PON Analyzer & Multi-Gigabit Internet QoE Test Set
- MTX150x Lite - Multi-Gigabit Internet Services Test Set
- MTX150x - Multi-Gigabit Ethernet Services Installation Test Set
- FL41 - Optical Fault Locator
- FX41xT - Selective PON Optical Power Meter for G-PON and XGS-PON
- FX81T - 1G/10G Pass-Through PON Optical Power Meter
- VeSion R-Server - Centralized Workflow and Asset Management