
 The GNSS SkyView Antenna Installation Verification Tool is an optional test feature currently available in the MTTplus™ platform. This long-term test uses the optional GNSS receiver to monitor, track and record the signal quality from all the satellites in view, as they move across the sky, creating a polar representation (map) of the antenna's reception pattern. The newest version (2024) of this feature allows users to view the performance of each constellation independently. For more details, refer to the SkyView Introduction.
Original SkyView User Interface Version (2017)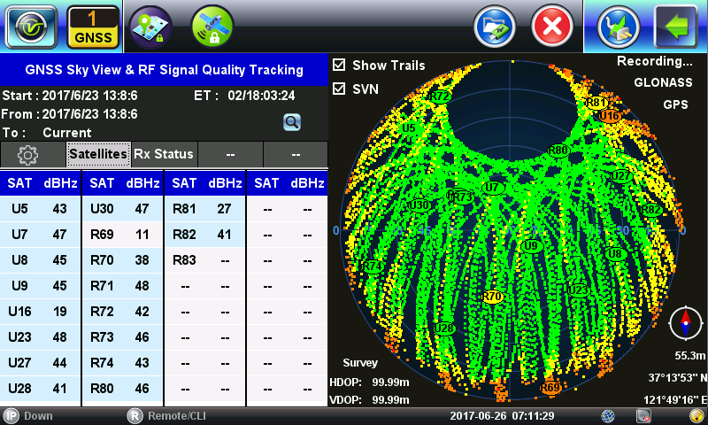
Improved SkyView User Interface Version (2024).png?width=688&height=413&name=SkyView%20User%20Interface%20(2024%20version).png)
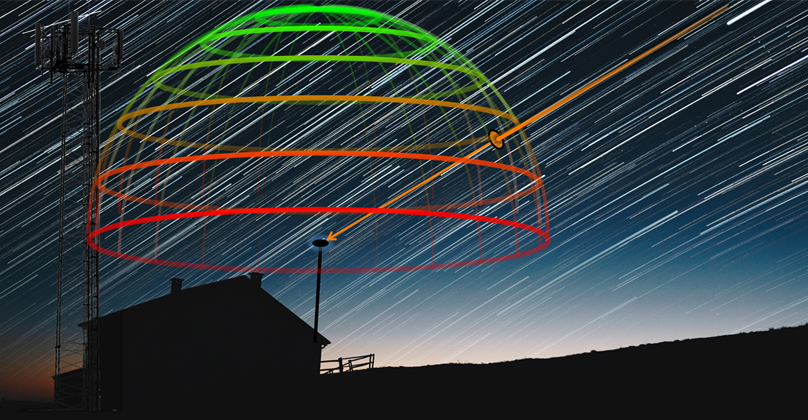
Signal quality is defined by the Carrier-to-Noise Density levels (C/No in dB-Hz) for each of the signals received from each of the satellites being tracked. Each datapoint consist of the satellite position (polar coordinates) referenced to the antenna location and the quality of the signal received. As time goes by, these datapoints paint a reception pattern map (heat map) that allows the identification of "black spots" and obstructions caused by nearby trees, walls, buildings, mountains, etc.


The regular antenna reception pattern map is a flat (polar) representation of the imaginary spherical half-dome (360º by 180º) representing the antenna's field of view towards the sky (from the horizon to the zenith).


The SkyView's test results include three or four different files (same name, different extensions):
- A .CSV file with the recorded C/No data from all the satellites tracked during the test period. SkyView can track satellites from all four major GNSS constellations. This test record format is provided for better spreadsheet graphing, data manipulation, filtering, analysis and reporting. Samples of customizable Excel templates are available in this link.
- A .PNG image of the resulting antenna coverage heatmap. Newer version of SkyView include the C/No color scale, antenna coordinates and constellations being tracked. “One image is worth more than a thousand words” since it truly summarizes the whole test.
- An optional .GNSSBIN raw data recording (when the Save Replay Files
 checkbox is enabled). It allows users to reload previous antenna measurements from a USB memory stick, play it back at different speeds, and enable/disable individual satellite constellations, to isolate constellation’s data. Note: This is a large file, so it should only be enabled it if you are planning to use it (e.g., troubleshooting, training, etc.)
 - An .XML file containing the coordinate recordings in GPS Exchange Format (GPX), a widely used open format that allows waypoint location data to be loaded to mapping platforms, such as OpenStreetMap, GIS.XL for Excel, Google Maps, Google Drive, etc.) or users can develop their own post-processing macros or scripts.
- Older versions of the SkyView application included an .NMEA text file, with recorded NMEA messages for all the constellations tracked during the test period. (Notepad++ or Word applications are recommended to open those legacy files.)
Using the Excel Templates
- Download the sample XLSX template: VeEX-GNSS_Antenna_Coverage-PolarTemplate.zip
- Insert a USB memory stick (FAT32, up to 64 GB) into the MTTplus.
- Run a SkyView test for >24 hours or when enough datapoints have been collected. A total of 72 hours is recommended for single or dual constellation antennas. Quad constellation antennas receive information from more satellites and may require 24 hours to build a good coverage map (however 48 to 72 hours is recommended).
- When finished:
- On older SkyView versions, tap on the
 button to expand the right-side menu and select Save Results to USB.
 - On Newer versions, go to the Status tab, Stop the test and tap on Save-> USB.
The files will be saved with the name entered in the File Name field. We recommend using descriptive file names with date codes (e.g., VeEX_HQ-Antenna_B-Fremont-20240412).
- On older SkyView versions, tap on the
- Tap on the
 button to Eject (Remove USB Drive), then unplug the USB memory stick from the MTTplus and insert it into a PC.
 - Open the desired CSV file from the /GNSS directory of the USB memory stick.
- Click on the top-left corner of the Excel file (where the row and columns meet) to select all rows and columns available in the file or use Ctrl+A.
- Use Ctrl+C to copy all the data.
- Open the Excel template file and immediately Save As with a distinctive relevant name (e.g., location, date, etc.). DO NOT modify the original template (always make a copy first). We recommend using the same file name used for the test set's SkyView data log.
- On the Paste Raw MTTplus Data tab, select the first top-left field (A1), then use Ctrl+V to paste all the data.
- Select the Coverage Graph Linear tab to view the resulting polar graph for the satellite reception (heat) map, with linear elevation axis.
- Save the file.

The (linear) polar graph from the Excel template may look a bit different than the one displayed on the test set's screen. This is because the Excel version uses a Max Hold technique to minimize the effects of temporary RF signal obstructions (e.g., clouds, rain, snow, birds perching, etc.).
Based on VeEX's practical field experience, this template divides the C/No data into six different segments (signal quality levels) and assigns a color to each of the resulting series. For a roof antenna, the recommended C/No density levels should be between 36 and 52+ dB-Hz (green), for elevations >10º above the horizon (except for known obstacles or antennas with restricted apertures). Note that the color scale used in the XLSX template is a bit different than the one used by the test set, as it offers more details and better definition. If desired, users could customize their own signal quality ranges and colors, to fit their own test procedures and requirements.
The template is set to handle up to 50,000 samples (rows), which is more than enough for 72-hour worth of data recordings. There is very little benefit from drawing more that 30,000 data points, especially when using quad-constellation antennas and receivers.
Users are free to try with other compatible spreadsheet programs, such as Google Sheets, Apple Numbers, LibreOffice Calc, etc. However, full compatibility is not guaranteed, and some modifications may be required.
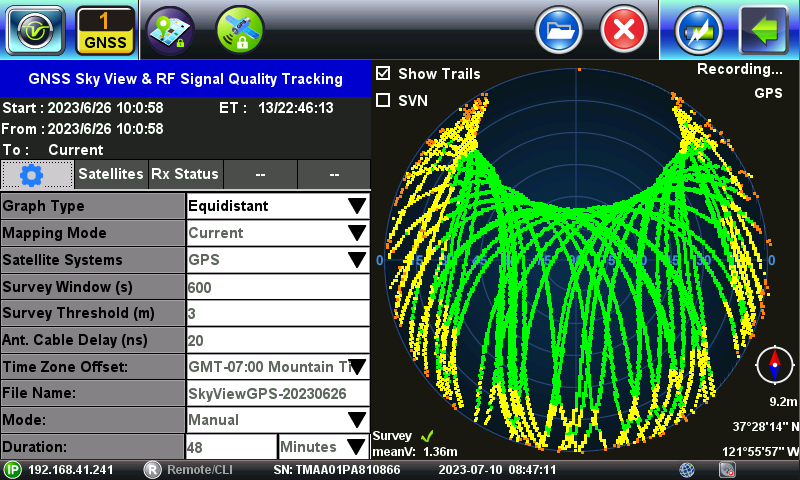
Note: The USA GPS global navigation satellite system is geosynchronous. That is, their satellites' orbits take exactly 1/2 sideral day (about 12 hours). From the antenna's point of view, the satellites in each of the six orbital planes always follow the same trail on the sky and will be in view every 24 hours. So, monitoring GPS only for more than 48 hours, may not provide any significant improvements to the coverage graph. It will just repaint the same trails over and over, such as this 13+ days test with GPS only (below).
It is recommended to combine the GPS constellation with any of the other satellite systems, which don't have orbital cycles that are exact multiples of the sideral day, like GLONASS (8/17), BeiDou (9/17) or Galileo (10/17). Their trails will be slightly offset (with reference to the antenna's ground position) every time they complete each orbit, helping to paint a better coverage picture by slowly scanning the sky, drawing different trail lines each time. GPS+Galileo or GPS+BeiDou are good complements, when using dual constellation receivers and/or antennas. For quad constellation receiver, it is recommended to record all four and all their bands, since they can be viewed separately.

Also, more available satellites mean more datapoints to build the graph faster.

Printing the Report
Once the datapoints are pasted and comments are written, print or PDF the tab containing the desired coverage graph. (Do not print the pages containing the data as it will take too many pages to print!)
A PDF report can be generated from Excel. Below is an example of a poor antenna installation (indoors).

You may also right-click on the edges of the desired coverage graph to copy and paste as an image into another document or Save-as-Picture, to be used later in other documents or reports.
VeEX Inc. may improve the template from time to time, so check the download link, regularly, for any new revisions.
Although users are encouraged to review, analyze and perhaps modify the content of the Excel XLSX file (e.g., to redefine the different quality levels or understand how Excel is used to convert the data from spherical coordinates, to polar and into cartesian X,Y representation, or how they are color-coded based on signal quality levels, etc.), said template is provided AS IS, with no further support from VeEX Inc.
However, suggestions from advanced Excel users on how to optimize and/or improve it, that could benefit other users, are always welcome. (e.g., using filters to isolate constellations or set date ranges, etc.)