
1. What's Needed
- Applicable wander measurement, TIE logging and Export licenses required for the target test application (E1, E3, STM1/OC3, 1G & 10G SyncE, IEEE C37.94).
- Micro-B to USB-A OTG adapter cable.
- FAT32 USB memory stick.
- MTX150 test set.

2. Record Wander (TIE) Data
- Launch the appropriate test application and set up the test set to match the configuration of the link, port or device under test.
- Connect the test set to the link or port under test and verify all applicable soft-LEDs are green (e.g., Signal, Frame, Alarm/Error) or grayed out (e.g., the Frame LED in unframed environments).
- Insert the USB memory stick into the USB adapter cable and connect the cable to the MTX150's micro-B USB port. The Folder icon in the System Tools menu should now show a green USB stick.
- Go to the Wander measurement function, select the External Reference Clock source type to be used and connect the physical clock signal to the respective SMA port.
- Use SMA port (A) for PDH, SDH and SONET signals under test.
- Use SMA port (B) for SyncE signals under test.
- Set Save TIE to ON and enter the desired File Name. It is recommended to leave the Sampling Rate at 30 samples per second.
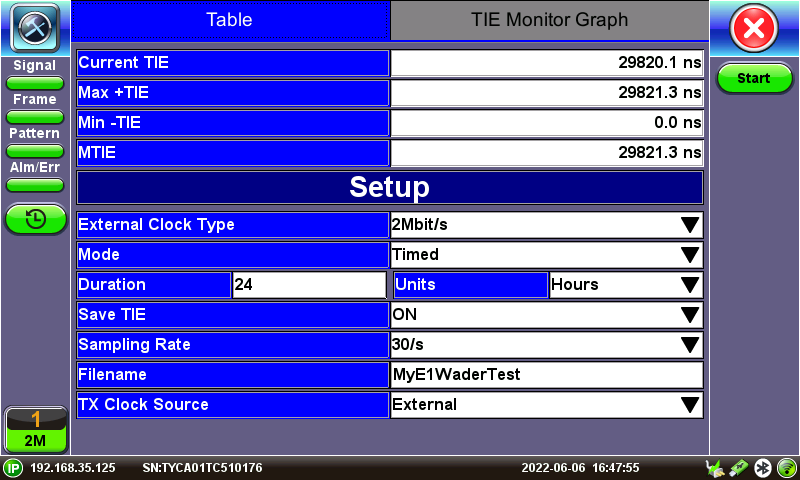
Note: In TDM applications, the TX Clock Source is used to generate a valid signal on the test set Tx1 port, when it is necessary to keep the link under test alive.
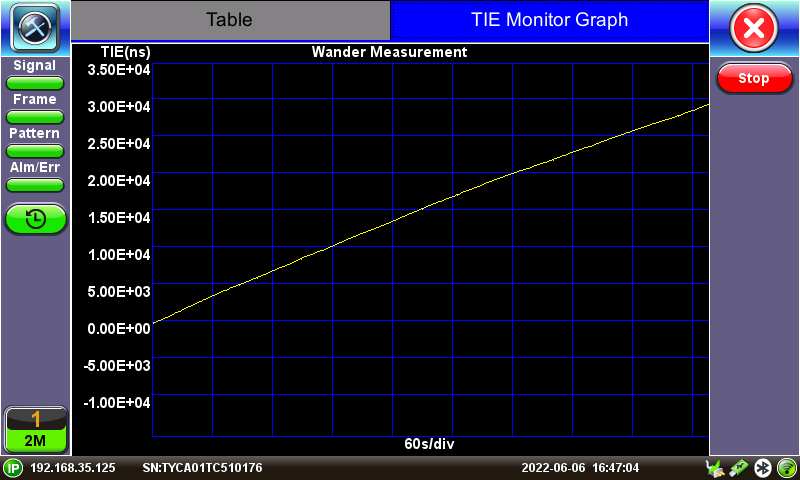
- Once Start is pressed, the TIE data is directly recorded into the USB memory stick, in the background, while measurements and the TIE Monitor Graph screens get updated. Do Not remove the USB memory while the test is running!
3. Perform TIE, MTIE and/or TDEV Analysis
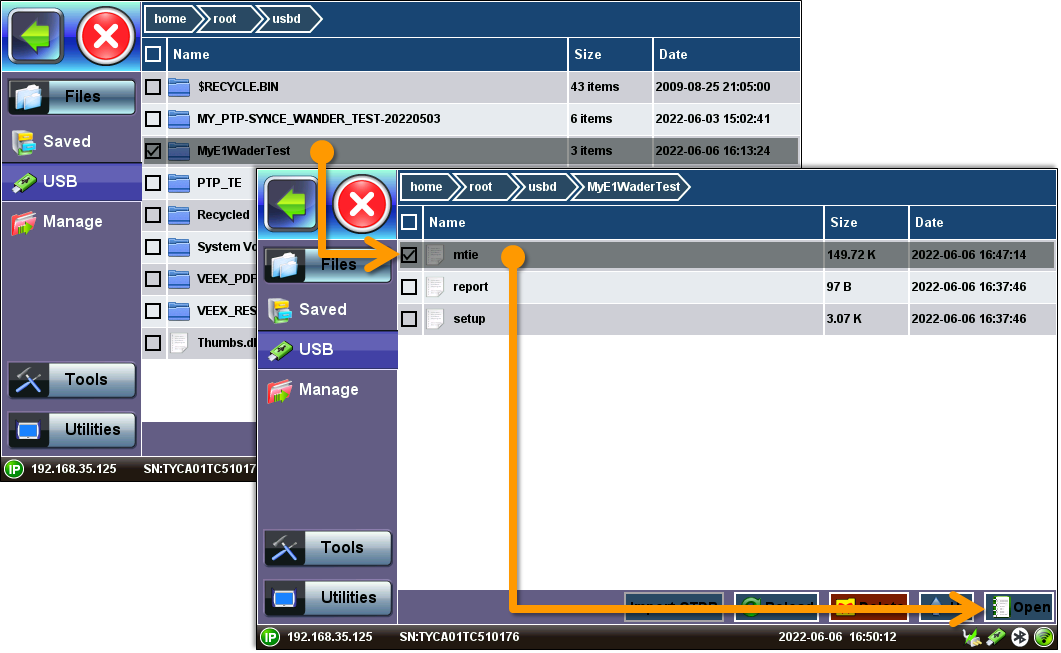
Whether the Wander measurement is still running (partial run-time analysis) or after Stop has been pressed, users can go to System Tools and tap on the green arrow button (->) to expand the left menu bar. Then select >Files >USB to display the memory stick's content. On the file browser screen, tap on the line item with the desired file name, to open the folder, select the MTIE file and tap on the Open button.
3.1 TIE Analysis Tab with Frequency Offset Calculation
By default, this screen shows a complete view of all the TIE data captured, so users can visually identify short-term, long-term stability issues, frequency offset (ramp) and other characteristics.

- Start Time: In YYYY-MM-DD hh:mm:ss format
- Total (s): Total measurement time, in seconds
- Frequency Offset (ppm): Frequency error calculated from all the samples in the selected Range and presented in parts-per-million. When the frequency of the recovered clock is accurate (compared to the reference clock), the ideal graph should show a flat horizontal trend.
- Start (s): Marks the beginning of the data presented on the graph. Users can change this value, to focus (zoom in) on specific areas of the sampled data, by entering the desired number (in seconds) on this field and pressing the Set Range button.
- End (s): Marks the end of the data presented on the graph. Users can change this value, to focus (zoom in) on specific areas of the sampled data, by entering the desired number (in seconds) on this field and pressing the Set Range button.
- Remove Offset: No, Yes. Users may elect to mathematically remove the effects of constant frequency offset from the data, to obtain Relative TIE.
- Marker: Tapping on the graph brings up the red crosshair marker. Users can tap on different areas of the graph to bring up specific datapoints. Use the < and > buttons to fine-tuning the marker position, sample by sample.
3.2 MTIE & TDEV Analysis Tab with Standard Masks Evaluation
Performs MTIE and/or TDEV analysis on the selected TIE or TE data range, and compares it against standard masks, providing PASS or FAIL verdicts.

The Save button generates a CSV file with MTIE and/or TDEV datapoints (including the masks) and saves it in the USB memory stick (same folder as the raw TIE data), so users can recreate the graph with a spreadsheet program.
The Convert to PDF button generates a simple report (text and graphs) and saves it in the USB memory stick (same folder as the raw TIE data), so users can immediately share it, without requiring any external PC software. Nonetheless, for better presentation, the VeEX Wander Analysis PC Software is recommended. For more details about the post-processing software, follow the link.
The VeEX Wander Analysis PC Software offers more detailed analysis, reports, exports, and access to more standard masks.
Use the red (X) icon to return to the Wander Measurement screen.
The TIE files can be re-analyzed at any time, using the MTX150's built-in Wander Analysis feature. Just plug the USB memory stick in and Open the desired wander file.